A graph in a recent article in Fortune magazine caught my eye. The graph shows the cost of hosting the Summer Olympics over the past eight events. Here is what I termed the "Medal" graph. Now, practitioners of the art of Effective Graphics would likely find some shortcomings in the graph. Clearly
English
Bar chart with response sort
Change your passwords without locking out your connection
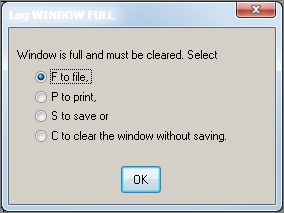
Did you change your LinkedIn password yesterday? (If you didn’t, you should!) But did it happen to be the same as your corporate password? First, tisk tisk. Second, change your corporate password NOW! Ok, now that this is done ~ don’t let your saved connection profile for SAS applications lock
User conferences = Busy summer
It’s going to be a busy summer with a lot of travel. I’ve been invited to several user conferences so I’m really excited to get to meet even more SAS users, pick up some great tips for others, and wear myself out chatting.