SAS Professionals provides climate for success

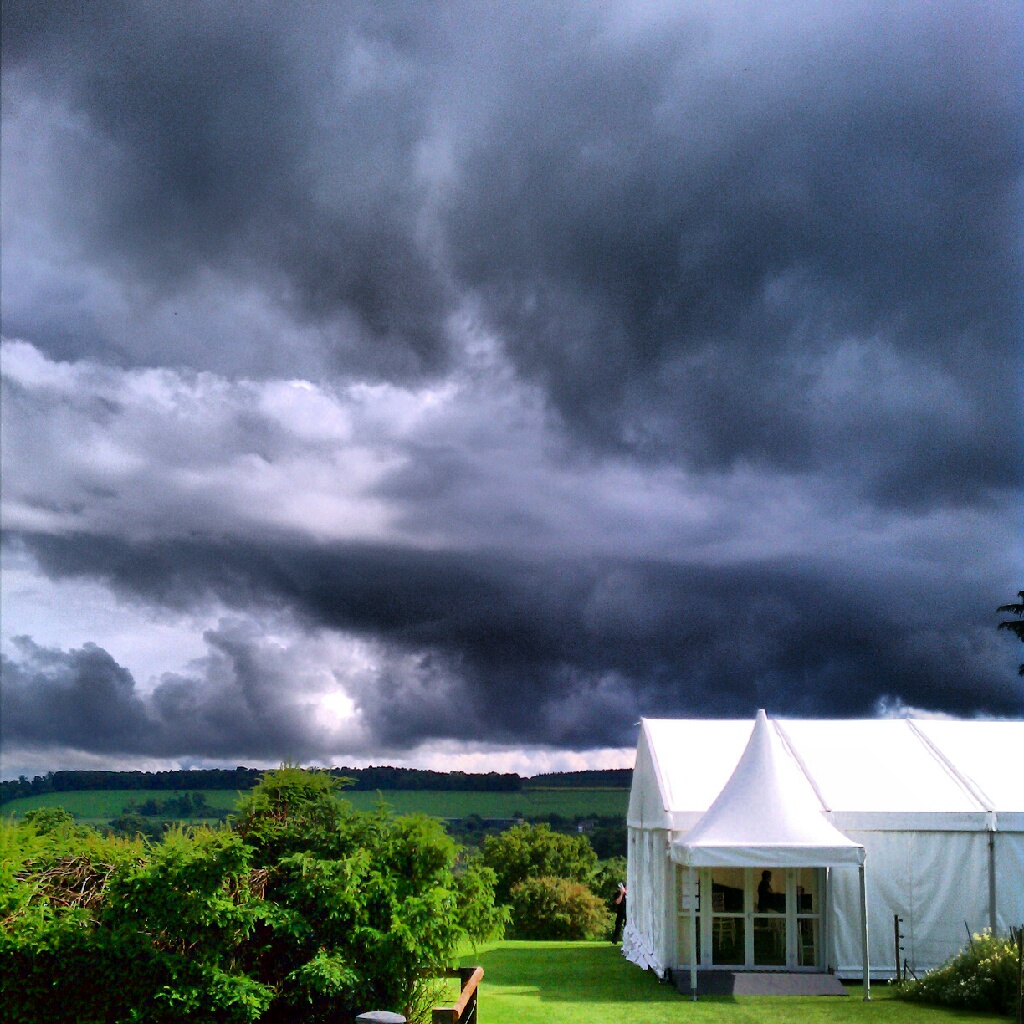
"Welcome to the English summer." "In the US you have climate. In England we have Weather." These are just two of the familiar phrases I heard yesterday during the SAS Professionals Convention held at SAS UK in Marlow. The weather changed from sun to dark clouds to rain and even