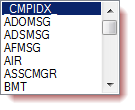
At theĀ 2012 SAS Global Forum, one of the questions from a user was about showing the original data used for the box plot. While you can use outliers in conjunction with the box features to get a feel for the data, for some situations you may need to see exactly
English
'Unbox' Your Box Plots
SAS has amped up mobile
SAS already has some cool mobile Business Intelligence apps. Now, Scott McQuiggan tells Anna Brown, in this Inside SAS Global Forum interview, that you can view the really cool high-performance analytics reports that you've created on your desktop - right from your mobile device. Check this out!!
Checking your answers: Are computed values close to the true values?
In statistical programming, I often test a program by running it on a problem for which I know the correct answer. I often use a single expression to compute the maximum value of the absolute difference between the vectors: maxDiff = max( abs( z-correct ) ); /* largest absolute difference