When is a correlation matrix not a correlation matrix?

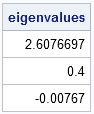
This article is an excerpt from my forthcoming book Simulating Data with SAS. Not every matrix with 1 on the diagonal and off-diagonal elements in the range [–1, 1] is a valid correlation matrix. A correlation matrix has a special property known as positive semidefiniteness. All correlation matrices are positive