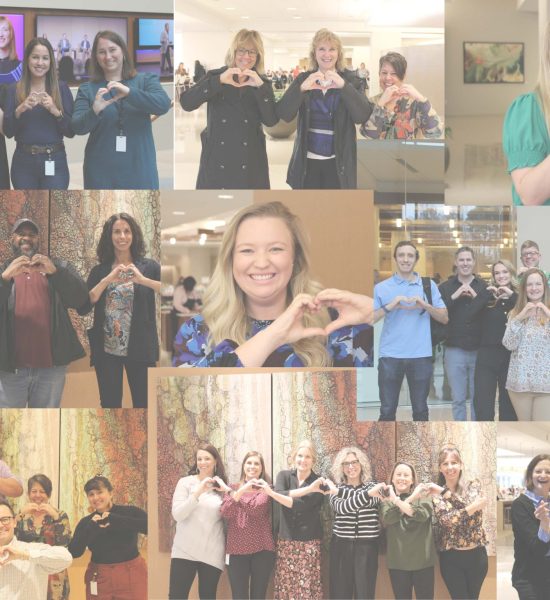
Explore International Women's Month celebrations across cultures

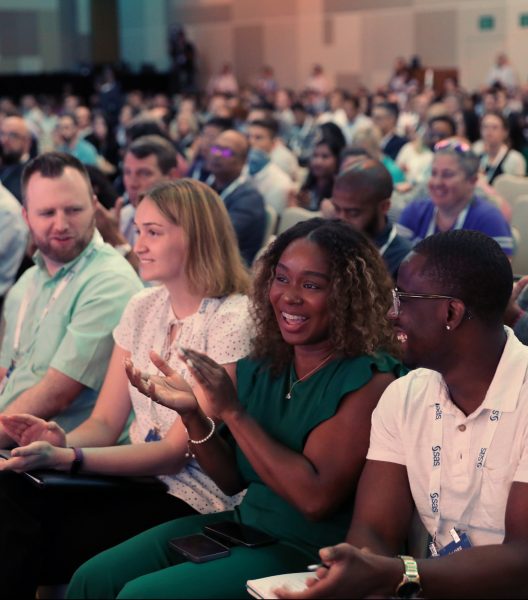
This International Women's Day (IWD) was one of the best yet, with exciting things to celebrate across the globe! From a new blog series to upcoming events at SAS Innovate, Women in Analytics (WIA) is excited to play a part in empowering and advocating for women at SAS and outside