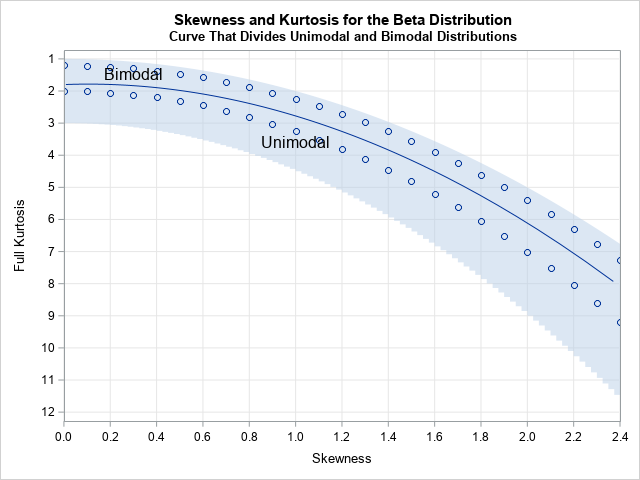
English

Tapan Patel 0
Enhanced online community for SAS Data Mining

I'm happy to announce the SAS Data Mining online community forum has a new look and feel! There’s lots of additional content and functionality too. The SAS Data Mining community on support.sas.com is a central communications hub for anyone interested in SAS Predictive Analytics and Data Mining topics. Community Manager Anna

Rick Wicklin 0
How to color clusters in a dendrogram

The CLUSTER procedure in SAS/STAT software creates a dendrogram automatically. The black-and-white dendrogram is nice, but plain. A SAS customer wanted to know whether it is possible to add color to the dendrogram to emphasize certain clusters. For example, the plot at the left emphasizes a four-cluster scenario for clustering

Data Visualization
Sanjay Matange 0
Schematic Plot

Recently a user chimed in on the SAS Communities page, requesting a way to add some observation level annotation to a box plot.  Wendy was delighted to see a graph created by the UNIVARIATE procedure called "Schematic Plot".  In this graph, the box plot of the analysis variable is shown with

Data Visualization
Sanjay Matange 0
BarLine Graphs

A Bar Line graph is commonly used in many domains.  The SGPLOT procedure makes it easy to create bar line graphs where the user can customize it in many different ways.  This post is prompted by a recent question on the communities page on creating such a graph, with one bar and

1 253 254 255 256 257 326