Bringing the Innovation Hub home

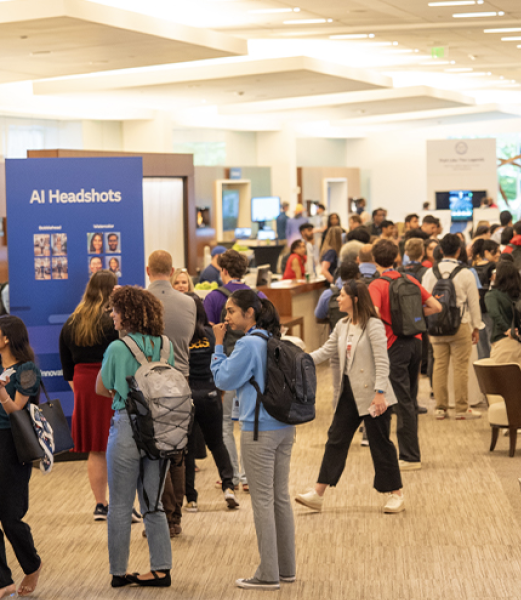
Imagine stuffing a 500,000-square-foot event space into a 5,000-square-foot hallway. That was the crazy idea I had when I checked out the Innovation Hub. The Innovation Hub was the center of the action at SAS Innovate in Las Vegas. Attendees saw demos of the hottest new SAS solutions, met the technical