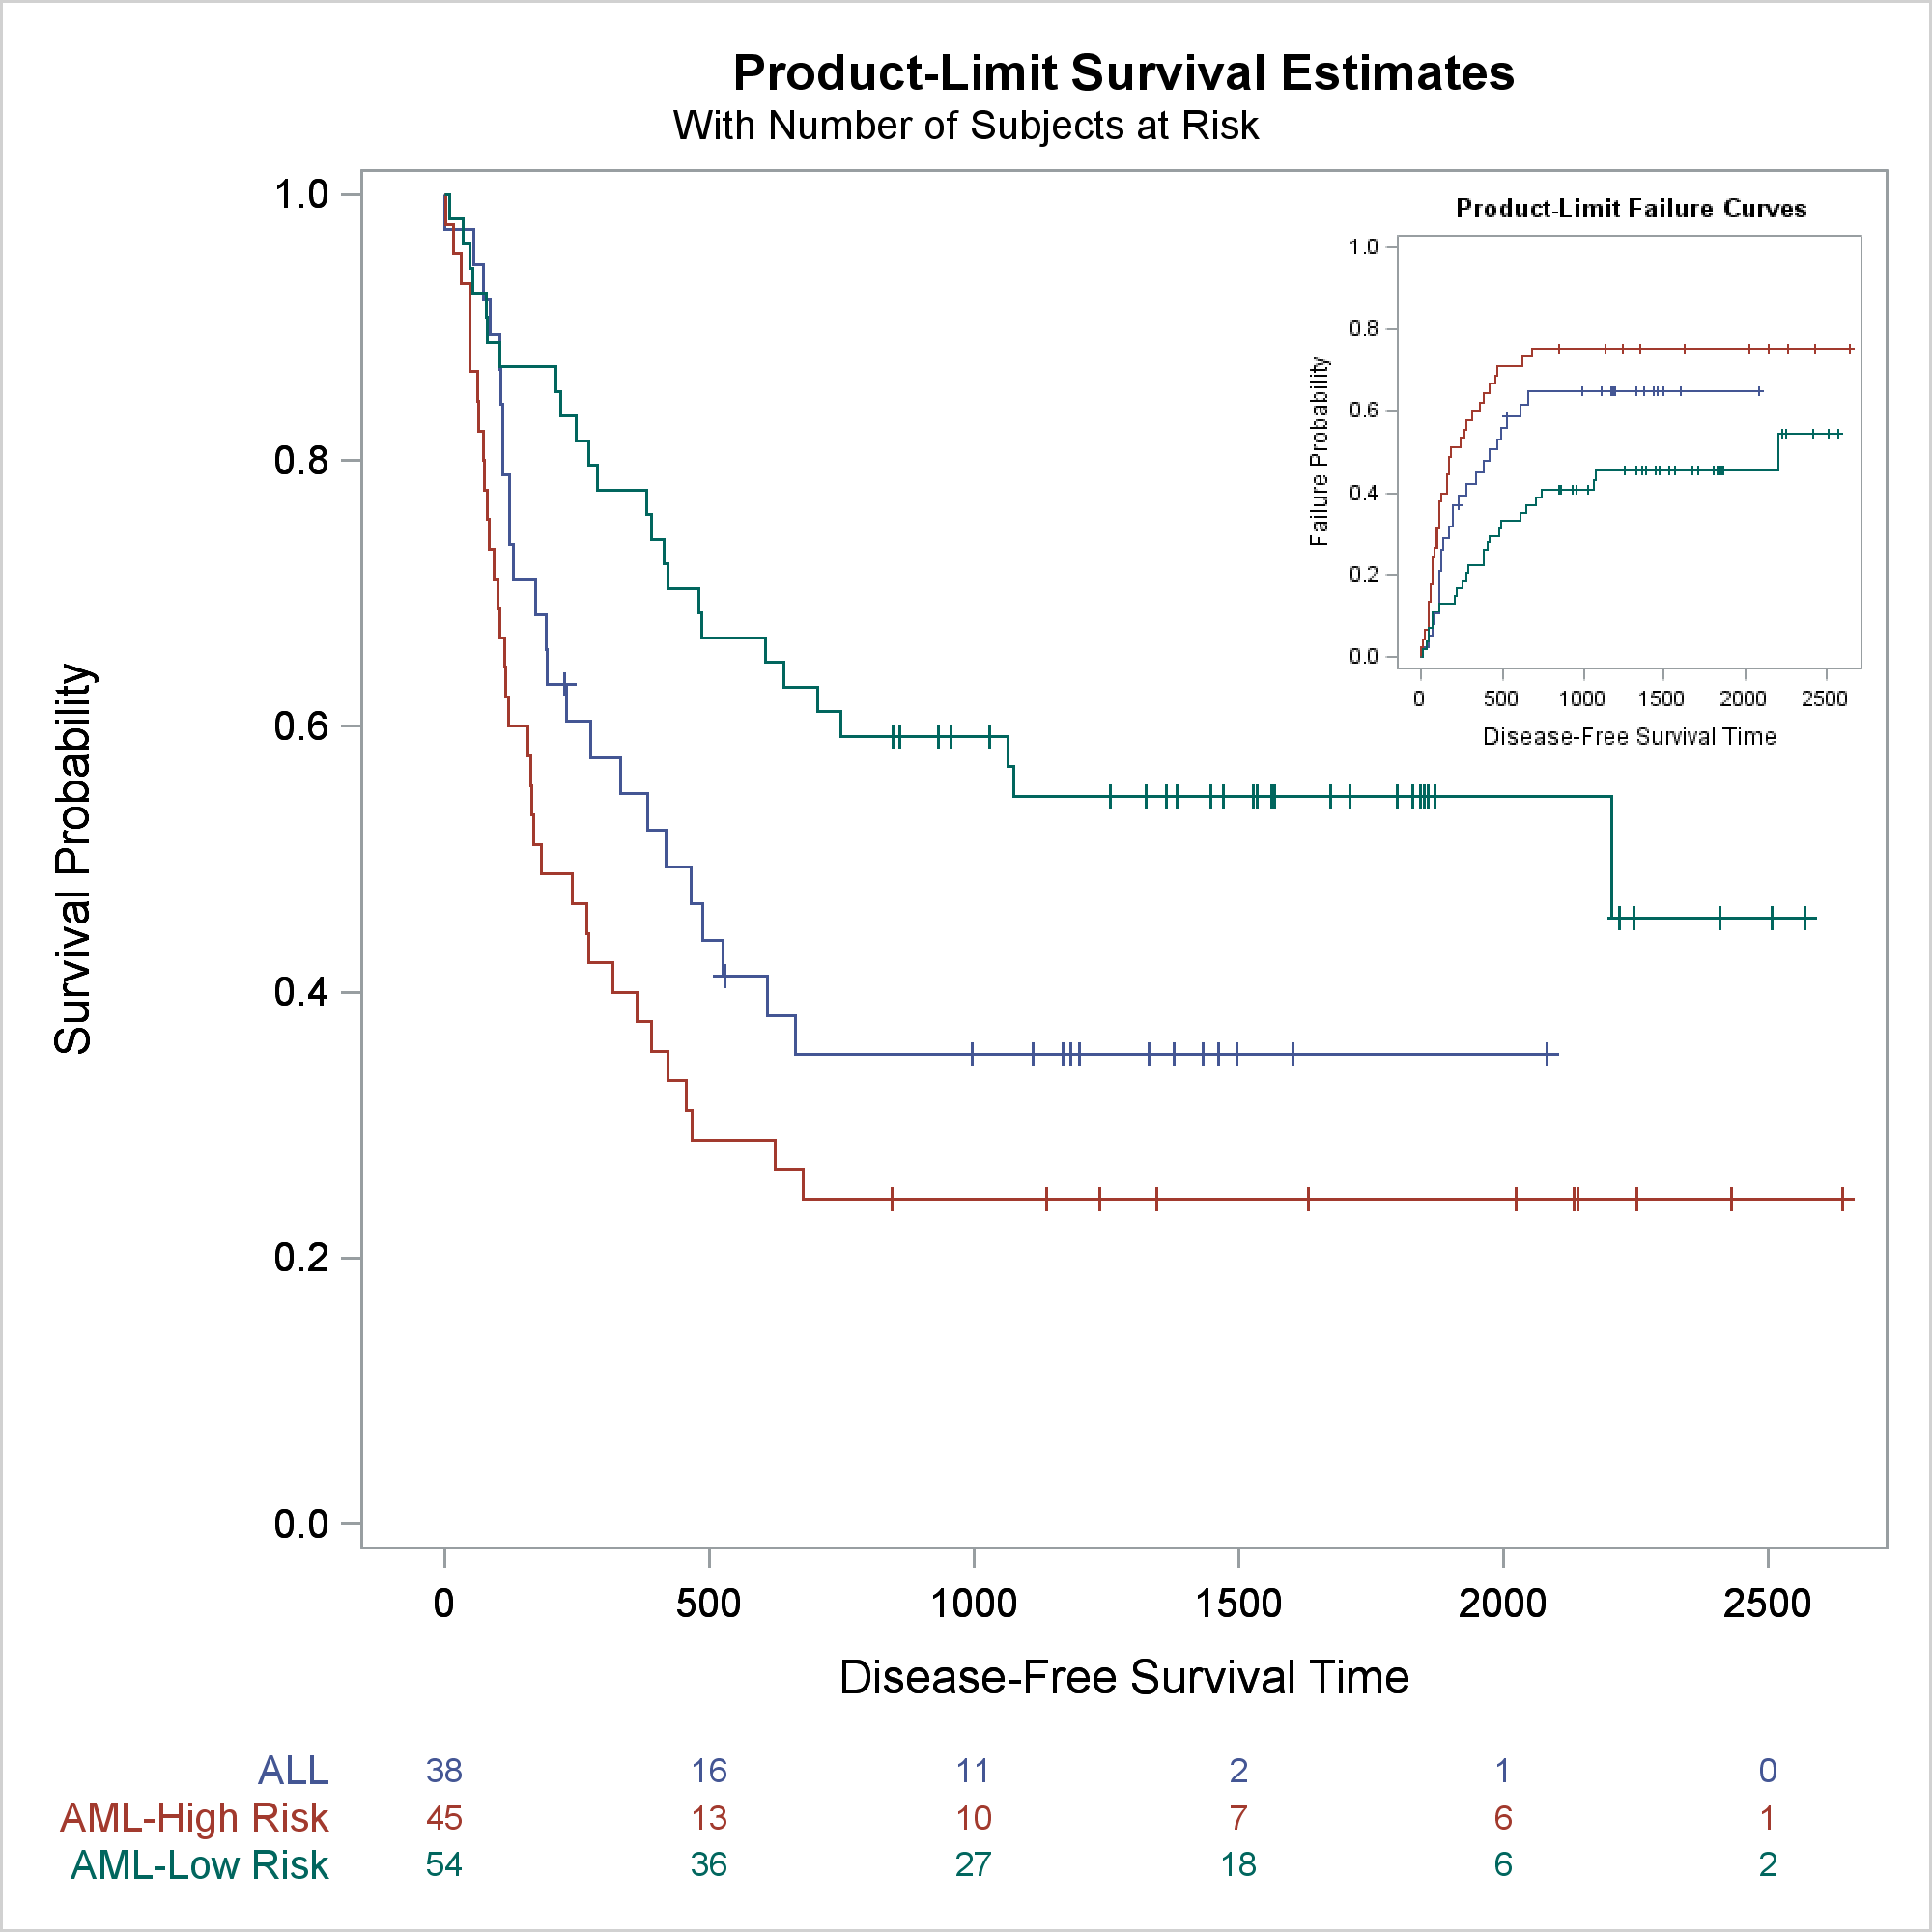
Advanced ODS Graphics: Inserting a graph into a graph

You can use SG Annotation (and its GTL equivalent) to display one graph inside another.
You can use SG Annotation (and its GTL equivalent) to display one graph inside another.

Have you heard the term “analytics economy” and wondered what it means? Or maybe you’ve wondered how your organization can use data and analytics to achieve economic gains. Now we have more than just data. We have accessible data, fueled by advances in compute power and connectivity, and interpreted by ever-more powerful
In my 25 years at SAS, I‘ve noticed the continued use of important algorithms, such as logistic regression and decision trees, which I’m sure will continue to be steady staples for data scientists. After all, they’re easy-to-use, interpretable algorithms. However, they’re not always the most accurate and stable classifiers. To

