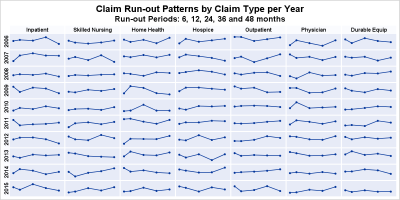
Understand the data for omnichannel
Once you have a data strategy for omnichannel, what's next? Kim Kaluba explains.
Once in a while you run into a pesky situation that is hard to overcome without resorting to major surgery. Such a situation occurs when you have a stacked bar chart with a discrete legend positioned vertically on the side of the graph. A simple example is shown below. title
Plot statements included in the graph definition can contribute to the legend(s). This can happen automatically, or can be customized using the KEYLEGEND statement. For plot statements that are classified by a group variable, all of the unique group values are displayed in the legend, along with their graphical representation