Get the right information, with visual impact, to the people who need it
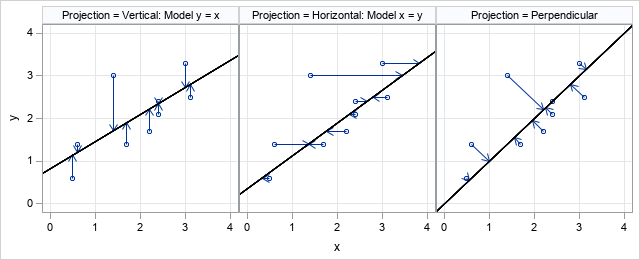
A SAS programmer wanted to create a graph that illustrates how Deming regression differs from ordinary least squares regression. The main idea is shown in the panel of graphs below. The first graph shows the geometry of least squares regression when we regress Y onto X. ("Regress Y onto X"

