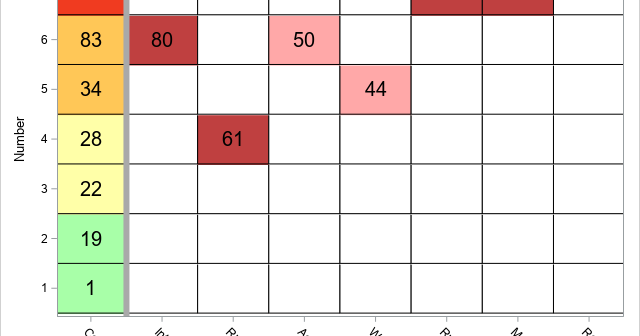
Get the right information, with visual impact, to the people who need it
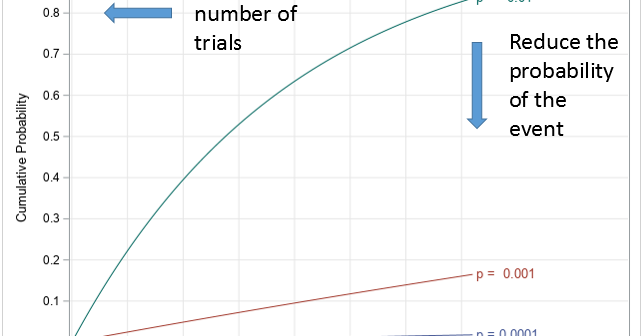
Every day we face risks. If we drive to work, we risk a fatal auto accident. If we eat red meat and fatty foods, we risk a heart attack. If we go out in public during a pandemic, we risk contracting a disease. A logical response to risk is to

