Get the right information, with visual impact, to the people who need it
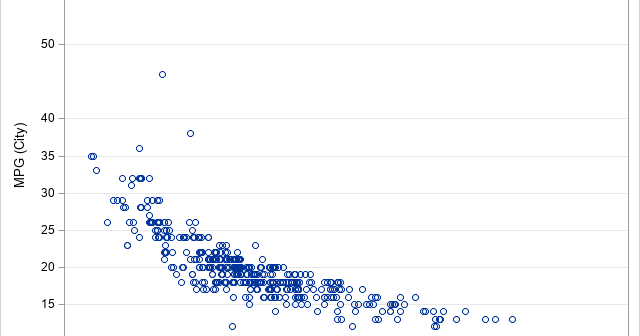
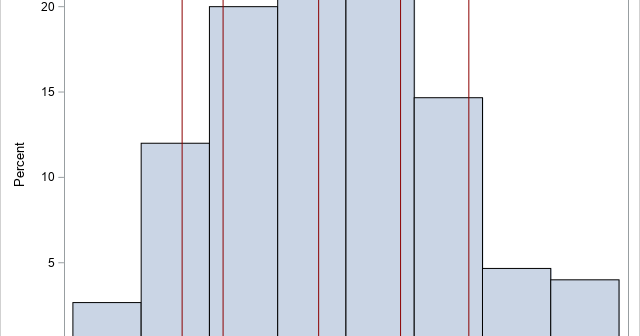
Have you ever heard of the DOLIST syntax? You might know the syntax even if you are not familiar with the name. The DOLIST syntax is a way to specify a list of numerical values to an option in a SAS procedure. Applications include: Specify the end points for bins

