Get the right information, with visual impact, to the people who need it
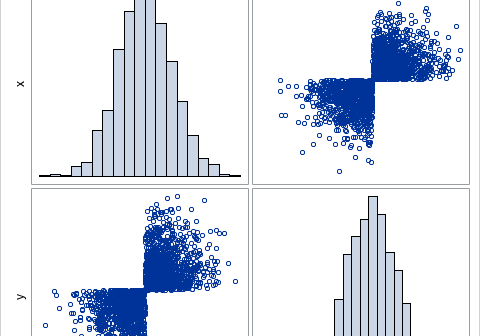
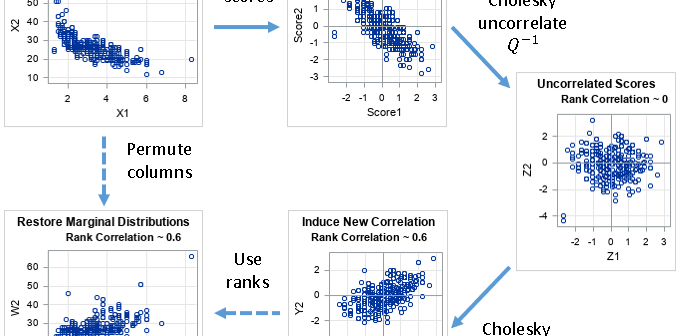
After my recent articles on simulating data by using copulas, many readers commented about the power of copulas. Yes, they are powerful, and the geometry of copulas is beautiful. However, it is important to be aware of the limitations of copulas. This article creates a bizarre example of bivariate data,

