Get the right information, with visual impact, to the people who need it
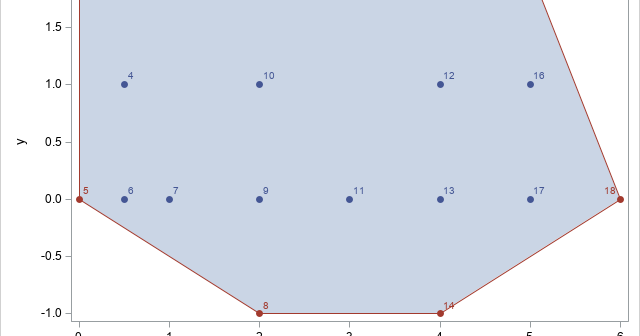
Given a cloud of points in the plane, it can be useful to identify the convex hull of the points. The convex hull is the smallest convex set that contains the observations. For a finite set of points, it is a convex polygon that has some of the points as

