I have previously written about how to plot a discontinuous function in SAS. That article shows how to use the GROUP= option on the SERIES statement to graph a discontinuous function. An alternative approach is to place a missing value for the Y variable at the locations at which the graph is not continuous. You can also display reference lines at the points of discontinuity.
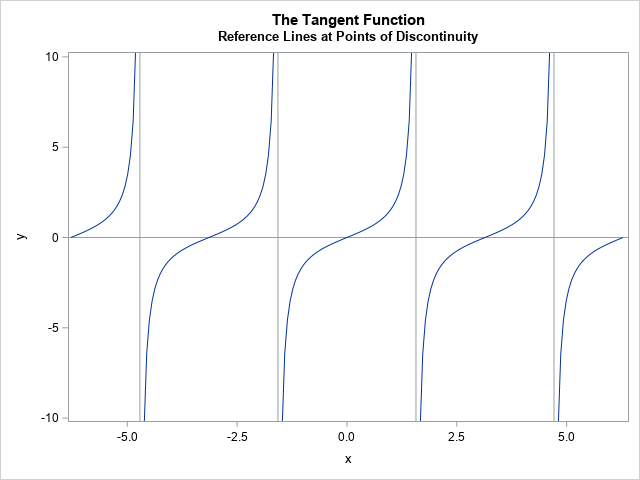
An example of a graph of a discontinuous function is shown at the right. This function is the tangent function, which has discontinuities at odd multiples of π/2, as indicated by the gray vertical lines. This article describes the following techniques for graphing discontinuous functions in SAS:
- Tip #1: Use a GROUP variable
- Tip #2: Use missing values and the BREAK option
- Tip #3: Use reference lines to indicate the points of discontinuity
An important special case of a discontinuous function is a piecewise-constant step function, which is discussed in a separate article. In statistics, you can use a step function to visualize the empirical cumulative distribution of data.
Tip #1: Use a GROUP variable
A previous article shows how to add a grouping variable to the data for a discontinuous function. The grouping variable identifies intervals on which the function is continuous. The SERIES statement in PROC SGPLOT will automatically draw each curve on each interval without connecting points across a discontinuity.
For example, consider the following function, which is a piecewise polynomial:
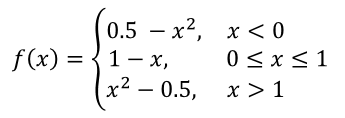
The following SAS DATA step evaluates the function on three intervals. On each interval, the function is continuous. The DOMAIN variable is a grouping variable that identifies each interval. The graph is visualized by using the SERIES statement in PROC SGPLOT. When you use the GROUP= option, the individual segments are drawn without connecting points in different segments.
/* Method 1: Create a grouping variable that identifies the continuous segments https://blogs.sas.com/content/iml/2013/03/25/plot-a-discontinuous-function.html */ data Func; Domain = 1; do x = -1 to 0 by 0.1; y = 0.5-x**2; output; end; Domain = 2; do x = 0 to 1 by 0.1; y = 1-x; output; end; Domain = 3; do x = 1 to 2 by 0.1; y = x**2 - 0.5; output; end; run; title "A Discontinuous Function"; title2 "The GROUP= Option"; proc sgplot data=Func noautolegend; series x=x y=y / group=Domain lineattrs=GraphDataDefault; run; |
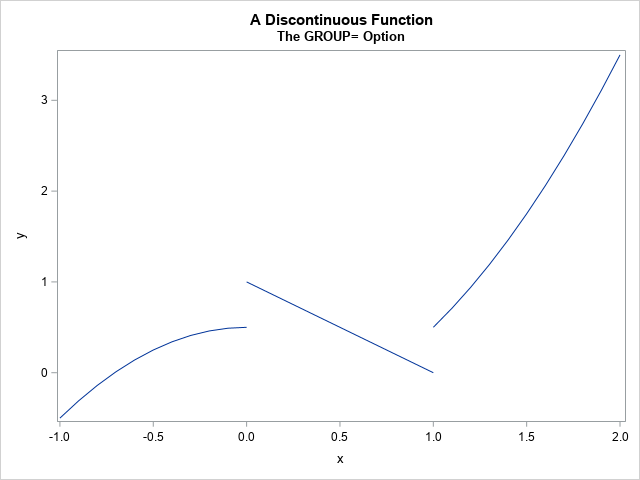
By default, each curve segment will appear in a different color. If you want them to be the same color, you can use the LINEATTRS= option to specify the line attributes, as shown in the previous program.
Tip #2: Use missing values and the BREAK option
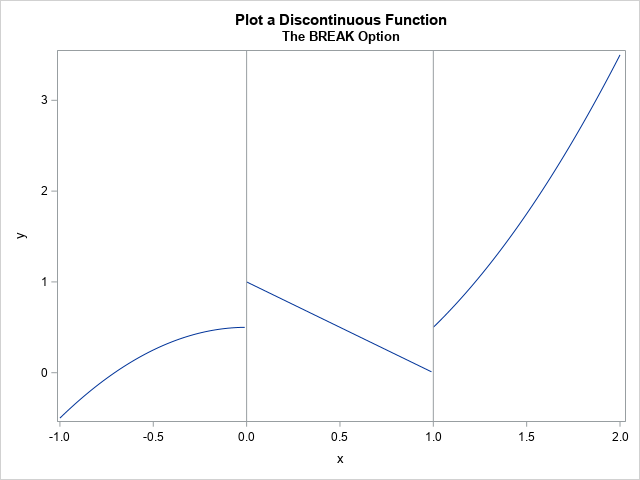
The BREAK option on the SERIES statement tells the SGPLOT procedure not to connect consecutive points along a curve if the Y value is missing. Therefore, you can visualize a discontinuous function by specifying a missing value for Y at the points of discontinuity.
The following program contains three DATA steps. The first evaluates the discontinuous function at an evenly spaced set of points. The second defines the points of discontinuity. The third concatenates the two data sets. The data are then sorted by using PROC SORT. The BREAK option on the SERIES statement in PROC SGPLOT creates the visualization. The REFLINE statement displays vertical reference lines at the points of discontinuity.
/* Method 2: Add missing value at the break points and use the BREAK option. The BREAK option does not connect across a missing value. */ data Func2; do x = -1 to 2 by 0.01; /* use smaller step size */ if x < 0 then y = 0.5-x**2; else if x <= 1 then y = 1-x; else y = x**2 - 0.5; output; end; run; data BreakPoints; retain y .; x = 0; output; x = 1; output; run; data DisconFunc; set Func2 BreakPoints; run; proc sort data=DisconFunc; by x; run; /* important to sort the data by x */ title "Plot a Discontinuous Function"; title2 "The BREAK Option"; proc sgplot data=DisconFunc; series x=x y=y / break; refline 0 1 / axis=x; /* optional: plot the locations of the break points */ run; |
Tip #3: Use reference lines to indicate the points of discontinuity
The previous example uses a REFLINE statement to indicate the points of discontinuity. The locations of the reference lines are specified manually, even though that information was already available in the BreakPoints data set. In some situations, it is more convenient to directly read the points from the BreakPoints data. A previous article describes how to use a data set to specify the location of reference lines.
A good example is the tangent function. The tangent function is discontinuous at odd multiples of π/2. The following DATA steps evaluate the tangent function and compute an indicator variable that is constant on the intervals (-π/2, π/2), (π/2, 3π/2), and so forth. It also creates a data step that contains the points of discontinuity and merges that data set with the original data. Finally, it plots the data and overlays reference lines at the points of discontinuity.
/* You can put the location of the breaks in a separate data set, which is useful for periodic functions like tan, cot, sec, csc, etc. Tip: Use the same number of points in each domain such as (-pi/2, pi/2). Choose a step size of the form pi/k. */ data Tan; pi = constant('pi'); do x = -2*pi to 2*pi by (4*pi)/(4*51); y = tan(x); Domain = floor( (x + pi/2) / pi ); /* constant on (-pi/2, pi/2) and translations of this interval */ output; end; drop pi; run; data BreakPoints; pi = constant('pi'); do k = -3 to 3 by 2; /* odd multiples of pi/2 */ z = k*pi/2; output; end; keep z; run; data PlotTan; merge Tan BreakPoints; run; title "The Tangent Function"; title2 "Reference Lines at Points of Discontinuity"; proc sgplot data=PlotTan noautolegend; refline 0 / axis=y; /* X axis */ series x=x y=y / group=Domain lineattrs=GraphDataDefault; yaxis min=-10 max=10; /* truncate range */ refline z / axis=x; /* the locations of the reference lines come from a data set */ run; |
The graph is shown at the top of this article. By reading the points of discontinuity from a data set, you do not have to type numbers like 1.5707963268 (=π/2) on the REFLINE statement.
Summary
In summary, this article shows three tips for graphing discontinuous functions. To prevent the SERIES statement in PROC SGPLOT from connecting points across a discontinuity, you can either use a GROUP variable or you can use missing values and the BREAK option. To show the locations of the discontinuities, you can use the REFLINE statement. You can either specify the locations manually, or you can read them from a data set.
