Every day we face risks. If we drive to work, we risk a fatal auto accident. If we eat red meat and fatty foods, we risk a heart attack. If we go out in public during a pandemic, we risk contracting a disease. A logical response to risk is to mitigate the risk by making healthy choices. Don't text while driving. Modify your diet. Stay at home as much as possible during a pandemic.
Unfortunately, sometimes individuals do not make wise choices. During the early stages of the coronavirus outbreak, there were reports of people ignoring social-distancing guidelines and congregating on beaches and in bars. Rick McAnulty, a psychologist and professor of psychology at UNC-Charlotte, states that noncompliance with health-related issues is widespread and is not limited to the coronavirus pandemic. In general, he says, "People estimate the probability of risk—and decide the odds outweigh probable danger."
But how do people "estimate the probability" of a risk? Unless you are an expert in traffic accidents, heart disease, or viruses, a realistic estimate is too complicated for most of us. However, there is a simple probability model that demonstrates how the probability of a disastrous result increases due to repeated exposure to risk. In simple terms, if doing some action might lead to a bad result, you can reduce your overall risk by
- doing that action less often
- reducing the probability that the action leads to the bad result
Yes, this is common sense, but you can also demonstrate these facts mathematically by using a probability model, as shown in subsequent sections. I will use the spread of coronavirus as a motivating example, but be aware that I am a statistician, not an expert in infectious diseases.
A statistical model for risk
During the coronavirus pandemic, public-health experts advocate modifying our behavior to reduce the risk of catching and spreading the disease. The public-health directives can be classified into two broad categories:
- Reduce exposure: Some directives limit the number of interactions between susceptible people and infected people. These include closing places where people gather, limiting the size of groups, social distancing, and staying at home except for urgent needs.
- Reduce transmission: Other directives reduce the probability that an interaction between a susceptible person and an infected person will transmit the virus. These include washing hands, disinfecting surfaces, and wearing face masks. (Personal protective equipment, worn by health care workers, are also in this category.)
It is fortunate that the same social distancing that protects us from others also protects others from us!
You can use a simple probability model, called the "geometric distribution," to demonstrate why these directives are effective. The geometric distribution uses two terms that might be unfamiliar. A trial is an experiment that has two outcomes. One of the outcomes is labeled the event. The geometric distribution assumes that the trials are independent and that the event has the same probability of happening for each trial. I wrote a statistical article about the geometric distribution.
For example, you could define a "trial" to mean "go to the grocery store" and the "event" to mean "become infected with the coronavirus." There is a probability that the event occurs for each trial, and the model assumes that the probability is the same for each trial. Different activities might have different probabilities. Going to work might be riskier than going to the store, which might be riskier than a walk in the neighborhood.
If you know the probability that an event can happen for one trial, the cumulative geometric distribution gives the probability that it will happen on or before the nth trial, for n = 1, 2, 3, .... For example, if you specify the probability that someone becomes infected during an activity, the cumulative distribution gives the probability that the person will become infected if he repeats the activity one time, two times, and so forth.
The cumulative distribution of the geometric model
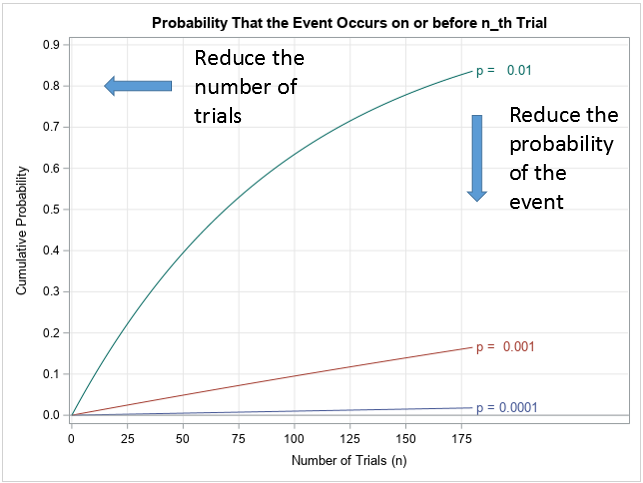
The graph to the right shows the cumulative probability as a function of n (the number of trials) for three hypothetical activities. (Click to enlarge.) For one activity (green curve, top), the probability that the event occurs for each trial is p=0.01 or 1%. The values along the curve show the probability that the event happens on or before the nth trial for n = 1, 2, 3, .... For a different activity (red curve, middle), the probability for each trial is only p=0.001 or 0.1%. For a third activity (blue curve, bottom), the probability is extremely small: p=0.0001 or 0.01%. These probability values are for illustration purposes only; they do not represent any specific activity that is related to contracting coronavirus.
There are three distinguishing features of the curves:
- For a specified event probability, the cumulative probability increases with the number of trials. Thus, the geometric distribution shows that you can reduce the cumulative probability of an event by reducing the number of trials.
- For a specified number of trials, the cumulative probability is lower when the underlying event probability is lower. Thus, if you can reduce the underlying probability of the event, you can perform the same number of trials with less risk.
- For very small probabilities, you can quantify how much the cumulative probability increases with each additional trial. Notice that the bottom curves look almost linear. As shown in my previous article, the slope of each curve is close to p. Thus, in the geometric distribution model, each additional trial increases the cumulative probability by approximately p. The chance that the event occurs on the first, second, and third trials is approximately p, 2p, and 3p, respectively.
As mentioned previously, public-health officials urge each individual to limit the number of person-to-person interactions, if possible. Unfortunately, some people (such as health care workers and grocery clerks) cannot control the number of people with whom they interact. Thus, the directives also instruct those workers (and we who interact with them!) to use other methods to reduce the probability of the underlying event (infection). Taken together, the directives try to move each member of the population "left and down" towards the lower-left corner of the graph, where the probability of infection is the lowest.
With random events, sometimes you are unlucky
If you hear that there is only a 1% chance that some random event will occur, you might be falsely lured into thinking you can take that risk about 100 times before you need to worry about it. THAT IS NOT TRUE. No matter how small the probability is, the event can happen on the first trial, or the sixth, or the tenth. You can't predict when an event will happen.
In a previous article, I showed how to simulate a random sample from the geometric distribution. One such sample is shown below for p=0.01. The graph represents 20 subjects who each repeated a trial until the event occurred. The graph shows an ordered list of the number of trials for the 20 subjects:
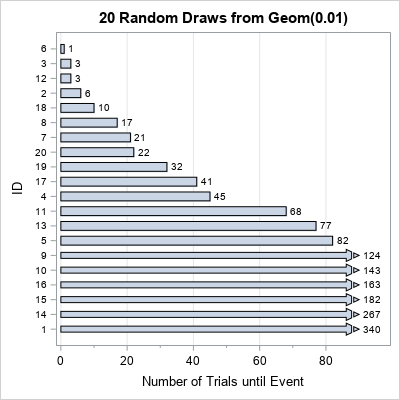
Of the 20 subjects, five experienced the event in 10 or fewer trials. One experienced the event on the first trial. These subjects were unlucky. There were also lucky subjects. For six subjects, the event did not occur before the 100th trial. On average, the expected number of trials until the event is 100, but there is large variation in these numbers. A small probability does not mean that the event will not happen.
Do we know the probability of catching coronavirus?
I will not attempt to assign a probability to "the event" of catching the coronavirus while engaging in everyday activities. Other mathematicians have made estimates earlier in the pandemic, and you can read about their efforts in the links below:
- Fergus Simpson is quoted in "Coronavirus: Maths expert reveals your chances of catching Covid-19" by Jasper Hamill, 23Mar2020, The Herald (Scotland)
- Fergus Simpson's blog post: "Coronavirus: A Personal Risk Assessment", published 21Mar2020
- Keith Devlin, a skilled mathematical writer: "Making Sense of the COVID-19 Data," published 01Apr2020.
Conclusions
The geometric distribution isn't complex enough to be realistic, and we don't have good estimates for the probability of catching the coronavirus, so what good is this simple model? Well, as the statistician George Box famously said, "All models are wrong, but some are useful." Even simple models can provide a qualitative description of the consequences of certain actions. You can use the cumulative geometric distribution to understand how actions under your control (social distancing, washing hands, ....) affect the probability of spreading coronavirus to yourself and to others. Specifically, the model supports the basic advice from health care professionals:
- Reduce your exposure. This moves you "to the left" in the graph of the geometric distribution model. Health care directives that limit interactions include staying at home when possible and practicing social distancing when you venture out.
- Reduce the probability of transmission. This moves you "down" in the graph of the geometric distribution model. Directives include washing hands, disinfecting surfaces, and wearing masks.
In addition, for very small probabilities, the geometric model shows that the cumulative probability of an event is approximately proportional to the number of trials. This quantifies how much each additional exposure increases the risk of transmission. Finally, the geometric distribution teaches a grim lesson: a small probability is still a nonzero. In a simulation of a random sample from the geometric distribution, there are usually individuals who experienced the event after only a few trials.
So help yourself and others by following the directives of health care professionals. The strategies they advocate are supported by science, common sense, and the mathematics of probability theory.

6 Comments
Rick, good post. Wouldn't there be at least one other variable involved besides just the probability of the event occurring that affects people's behavior in assessing risk of uncertain events? Like in economic analysis of risk, the cost or impact of the event if it occurs is a significant factor in determining behavior. So for younger people, they are not only assessing the probability of the event occurring, but the potential impact on them, which many young people feel is low (one could argue that it's not just about the impact on themselves, but that's another variable). Therefore, younger people are not as concerned about reducing risk as older people are due to the perceived lower cost of the impact of the event on them personally.
Absolutely. There are many psychological factors involved.
Again I emphasize that this is not an attempt to model the spread of a disease nor to model how attitudes and preconceptions affect how people act. As you say, a model like that would surely incorporate age, education status, gender, and many other variables. My goal is just to point out a simple mathematical fact: Even when you strip away all the complications that are involved in a realistic model, you still see that the public-health recommendations apply. Namely, to reduce the cumulative probability of an event, you should reduce the number of interactions (stay at home; social distancing) and reduce the probability of the event (wash hands; wear masks). These factors are the mathematical "core" to reducing the spread, which is why we hear so much about their importance.
This was an excellent read! It clearly, cogently and concisely presents concepts I've had difficulty explaining to my friends and family. Thanks for putting it together, Rick.
Rick,
This is stupendous post! Just curious if you have uploaded the SAS code that generates the graphs to the github?
All the techniques were shown in my previous post, but here's a link to the program for these graphs.
Thanks, the explanation nicely done and as you quote George Box: useful.