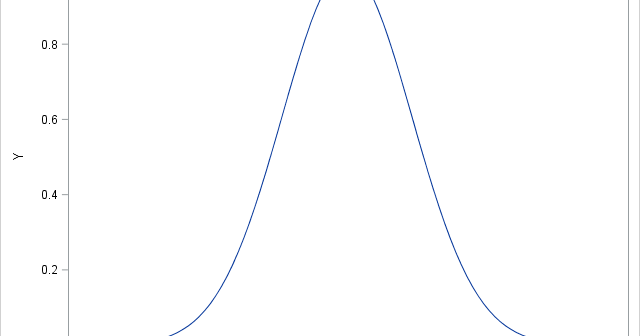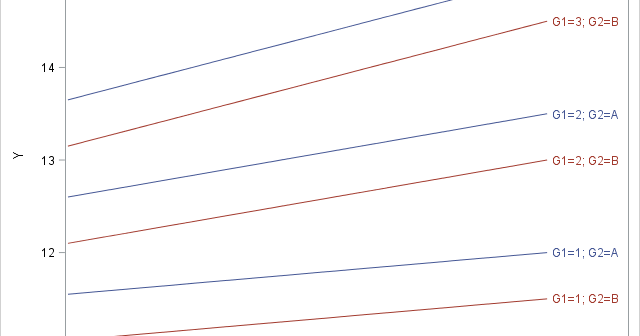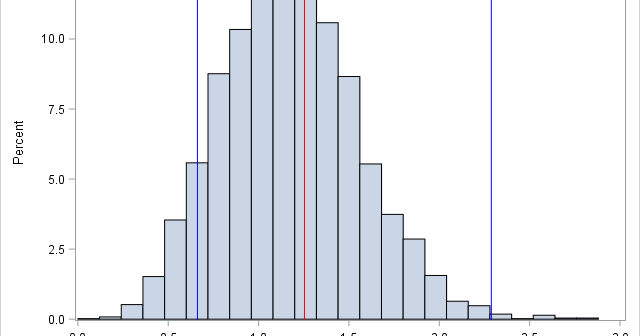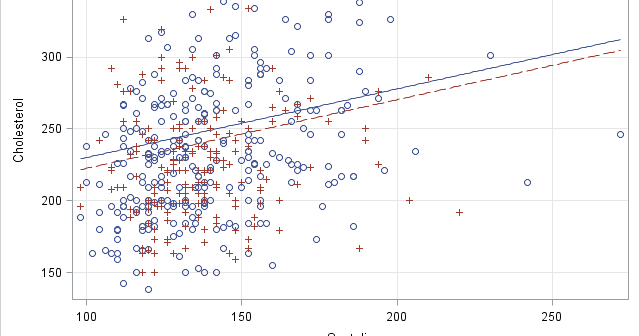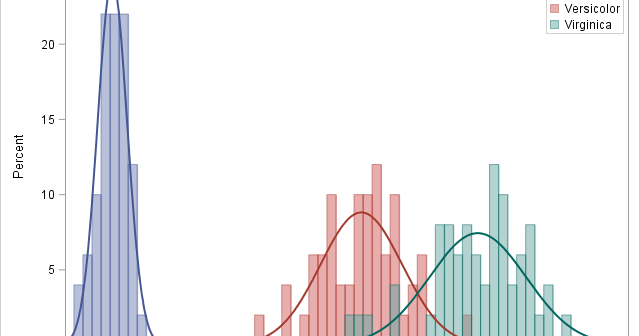
The SGPLOT procedure in SAS makes it easy to create graphs that overlay various groups in the data. Many statements support the GROUP= option, which specifies that the graph should overlay group information. For example, you can create side-by-side bar charts and box plots, and you can overlay multiple scatter
Tag: Tips and Techniques
I wrote more than 100 posts for The DO Loop blog in 2017. The most popular articles were about SAS programming tips, statistical data analysis, and simulation and bootstrap methods. Here are the most popular articles from 2017 in each category. General SAS programming techniques INTCK and INTNX: Do you
Slice, slice, baby! You've got to slice, slice, baby! When you fit a regression model that has multiple explanatory variables, it is a challenge to effectively visualize the predicted values. This article describes how to visualize the regression model by slicing the explanatory variables. In SAS, you can use the
Imputing missing data is the act of replacing missing data by nonmissing values. Mean imputation replaces missing data in a numerical variable by the mean value of the nonmissing values. This article shows how to perform mean imputation in SAS. It also presents three statistical drawbacks of mean imputation. How
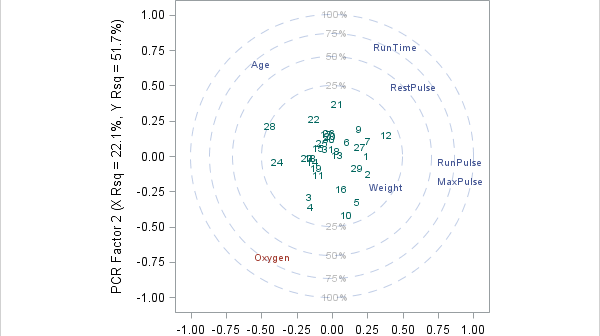
A common question on discussion forums is how to compute a principal component regression in SAS. One reason people give for wanting to run a principal component regression is that the explanatory variables in the model are highly correlated which each other, a condition known as multicollinearity. Although principal component
In a large simulation study, it can be convenient to have a "control file" that contains the parameters for the study. My recent article about how to simulate multivariate normal clusters demonstrates a simple example of this technique. The simulation in that article uses an input data set that contains
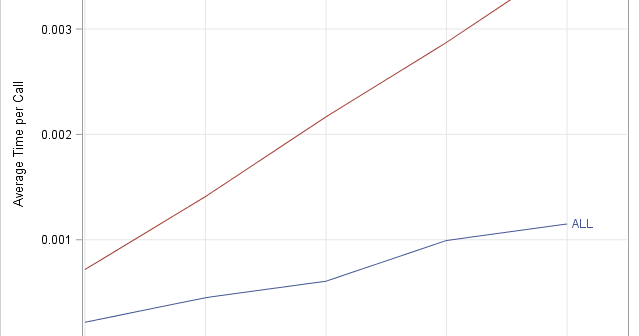
When you implement a statistical algorithm in a vector-matrix language such as SAS/IML, R, or MATLAB, you should measure the performance of your implementation, which means that you should time how long a program takes to analyze data of varying sizes and characteristics. There are some general tips that can
The SAS analytical documentation has a new look. Beginning with the 14.2 release of the SAS analytical products (which shipped with SAS 9.4m4 in November 2016), the HTML version of the online documentation has moved to a new framework called the Help Center. The URL for the online documentation is
For SAS programmers, the PUT statement in the DATA step and the %PUT macro statement are useful statements that enable you to display the values of variables and macro variables, respectively. By default, the output appears in the SAS log. This article shares a few tips that help you to
Do you want to create customized SAS graphs by using PROC SGPLOT and the other ODS graphics procedures? An essential skill that you need to learn is how to merge, join, append, and concatenate SAS data sets that come from different sources. The SAS statistical graphics procedures (SG procedures) enable