Tag: Tips and Techniques

Rick Wicklin 1
Ten tips before you run an optimization

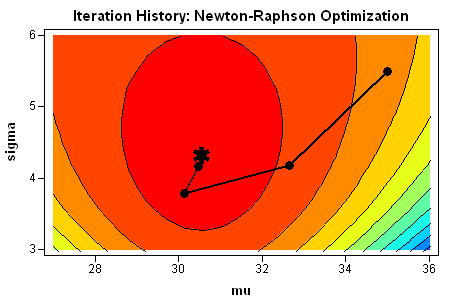
Optimization is a primary tool of computational statistics. SAS/IML software provides a suite of nonlinear optimizers that makes it easy to find an optimum for a user-defined objective function. You can perform unconstrained optimization, or define linear or nonlinear constraints for constrained optimization. Over the years I have seen many

Rick Wicklin 9
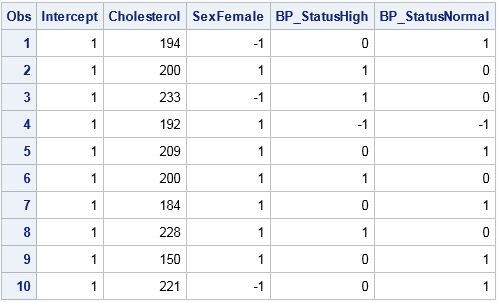
Four ways to create a design matrix in SAS

SAS programmers sometimes ask, "How do I create a design matrix in SAS?" A design matrix is a numerical matrix that represents the explanatory variables in regression models. In simple models, the design matrix contains one column for each continuous variable and multiple columns (called dummy variables) for each classification

Rick Wicklin 8
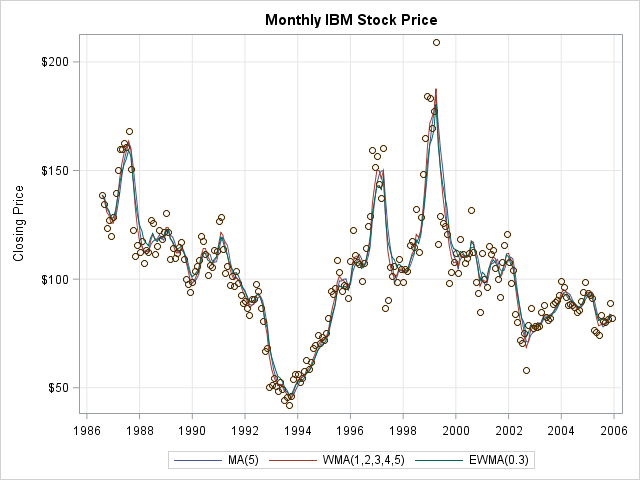
Compute a moving average in SAS

A common question on SAS discussion forums is how to compute a moving average in SAS. This article shows how to use PROC EXPAND and contains links to articles that use the DATA step or macros to compute moving averages in SAS. In a previous post, I explained how to

Rick Wicklin 3
Arrange matrices and graphs in a gridded layout

Last week my colleague Chris Hemedinger published a blog post that described how to use the ODS LAYOUT GRIDDED statement to arrange tables and graphs in a panel. The statement was introduced in SAS 9.4m1 (December 2013). Gridded layout is supported for HTML, POWERPOINT, and the PRINTER family of destinations

Rick Wicklin 2
The CUSUM-LAG trick in SAS/IML

Every year near Halloween I write a trick-and-treat article in which I demonstrate a simple programming trick that is a real treat to use. This year's trick features two of my favorite functions, the CUSUM function and the LAG function. By using these function, you can compute the rows of

Rick Wicklin 6
Generate evenly spaced points in an interval

I've previously written about how to generate a sequence of evenly spaced points in an interval. Evenly spaced data is useful for scoring a regression model on an interval. In the previous articles the endpoints of the interval were hard-coded. However, it is common to want to evaluate a function

1 3 4 5 6 7 15