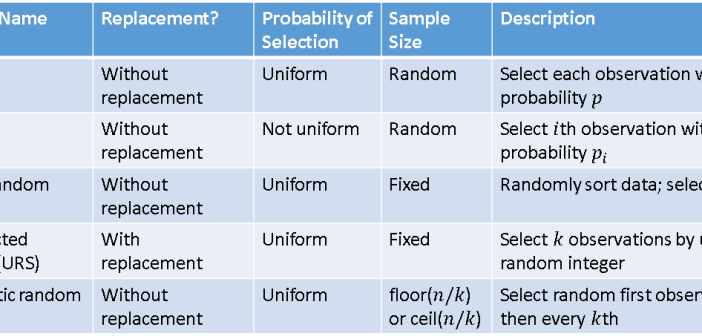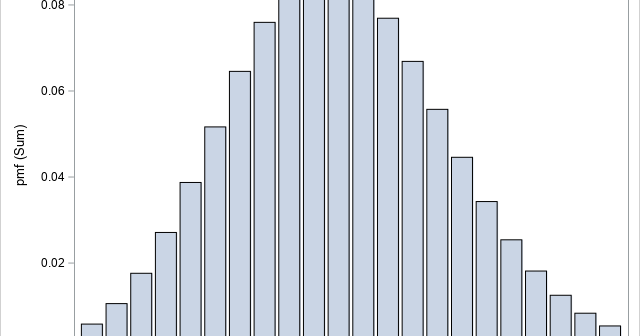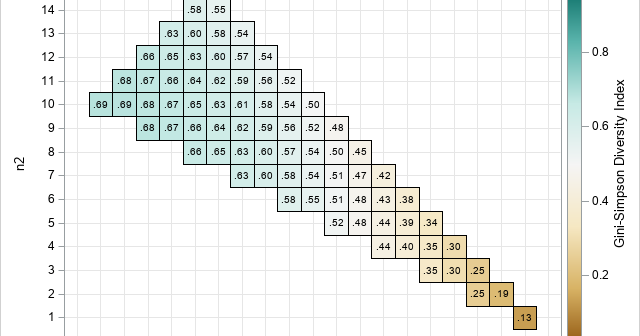
In SAS, the easiest way to draw random sampling from data is to use PROC SURVEYSELECT or the SAMPLE function in SAS IML software. I have previously written about how to implement four common sampling schemes by using PROC SURVEYSELECT and the SAMPLE function. The DATA step in SAS is
Tag: Tips and Techniques
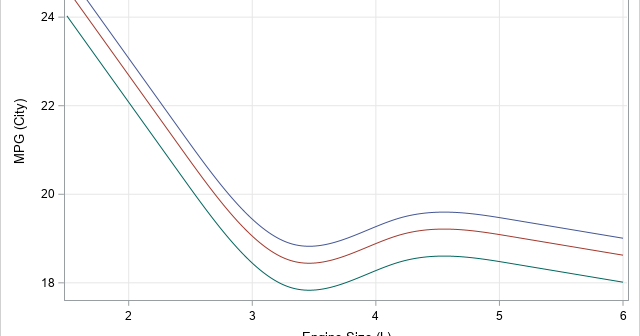
A SAS analyst read my previous article about visualizing the predicted values for a regression model that uses spline effects. Because the original explanatory variable does not appear in the model, the analyst had several questions: How do you score the model on new data? The previous example has only
Real-world data often exhibits extreme skewness. It is not unusual to have data span many orders of magnitude. Classic examples are the distributions of incomes (impoverished and billionaires) and population sizes (small countries and populous nations). The readership of books and blog posts show a similar distribution, which is sometimes
This article is about how to use Git to share SAS programs, specifically how to share libraries of SAS IML functions. Some IML programmers might remember an earlier way to share libraries of functions: SAS/IML released "packages" in SAS 9.4m3 (2015), which enable you to create, document, share, and use
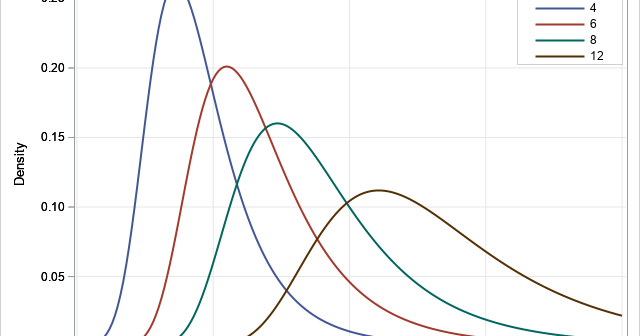
The moments of a continuous probability distribution are often used to describe the shape of the probability density function (PDF). The first four moments (if they exist) are well known because they correspond to familiar descriptive statistics: The first raw moment is the mean of a distribution. For a random
Monotonic transformations occur frequently in math and statistics. Analysts use monotonic transformations to transform variable values, with Tukey's ladder of transformations and the Box-Cox transformations being familiar examples. Monotonic distributions figure prominently in probability theory because the cumulative distribution is a monotonic increasing function. For a continuous distribution that is
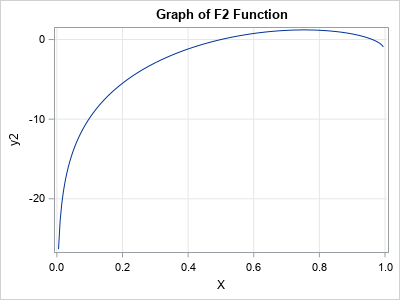
It isn't easy to draw the graph of a function when you don't know what the graph looks like. To draw the graph by using a computer, you need to know the domain of the function for the graph: the minimum value (xMin) and the maximum value (xMax) for plotting
A colleague was struggling to compute a right-tail probability for a distribution. Recall that the cumulative distribution function (CDF) is defined as a left-tail probability. For a continuous random variable, X, with density function f, the CDF at the value x is F(x) = Pr(X ≤ x) = ∫
It is important to be able to detect whether a numerical matrix is symmetric. Some operations in linear algebra require symmetric matrices. Sometimes, you can use special algorithms to factor a symmetric matrix. In both cases, you need to test a matrix for symmetry. A symmetric matrix must be square.
A SAS programmer asked an interesting question: If data in a time series has missing values, can you plot a dashed line to indicate that the response is missing at some times? A simple way to achieve this is by overlaying two lines. The first line (the "bottom" line in