In categorical data analysis, it is common to analyze tables of counts. For example, a researcher might gather data for 18 boys and 12 girls who apply for a summer enrichment program. The researcher might be interested in whether the proportion of boys that are admitted is different from the
Tag: Statistical Programming
Recently, I wrote about Bartlett's test for sphericity. The purpose of this hypothesis test is to determine whether the variables in the data are uncorrelated. It works by testing whether the sample correlation matrix is close to the identity matrix. Often statistics textbooks or articles include a statement such as
Recently, I showed how to use a heat map to visualize measurements over time for a set of patients in a longitudinal study. The visualization is sometimes called a lasagna plot because it presents an alternative to the usual spaghetti plot. A reader asked whether a similar visualization can be
What is McNemar's test? How do you run the McNemar test in SAS? Why might other statistical software report a value for McNemar's test that is different from the SAS value? SAS supports an exact version of the McNemar test, but when should you use it? This article answers these
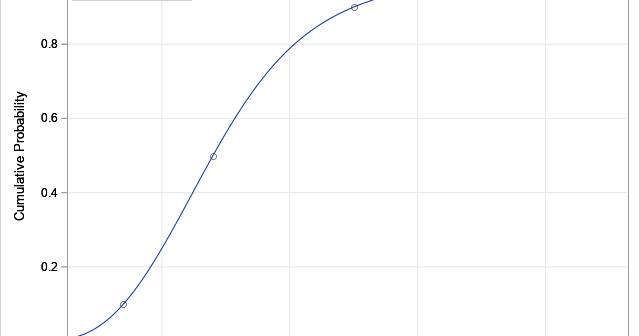
This article shows how to compute properties of a discrete probability distribution from basic definitions. You can use the definitions to compute the mean, variance, and median of a discrete probability distribution when there is no simple formula for those quantities. This article is motivated by two computational questions about
Statistical programmers need to access numerical constants that help us to write robust and accurate programs. Specifically, it is necessary to know when it is safe to perform numerical operations such as raising a number to a power without exceeding the largest number that is representable in finite-precision arithmetic. This
A previous article showed how to use SAS to compute finite-difference derivatives of smooth vector-valued multivariate functions. The article uses the NLPFDD subroutine in SAS/IML to compute the finite-difference derivatives. The article states that the third output argument of the NLPFDD subroutine "contains the matrix product J`*J, where J is
I previously showed how to use SAS to compute finite-difference derivatives for smooth scalar-valued functions of several variables. You can use the NLPFDD subroutine in SAS/IML software to approximate the gradient vector (first derivatives) and the Hessian matrix (second derivatives). The computation uses finite-difference derivatives to approximate the derivatives. The
Many applications in mathematics and statistics require the numerical computation of the derivatives of smooth multivariate functions. For simple algebraic and trigonometric functions, you often can write down expressions for the first and second partial derivatives. However, for complicated functions, the formulas can get unwieldy (and some applications do not
This article implements Passing-Bablok regression in SAS. Passing-Bablok regression is a one-variable regression technique that is used to compare measurements from different instruments or medical devices. The measurements of the two variables (X and Y) are both measured with errors. Consequently, you cannot use ordinary linear regression, which assumes that