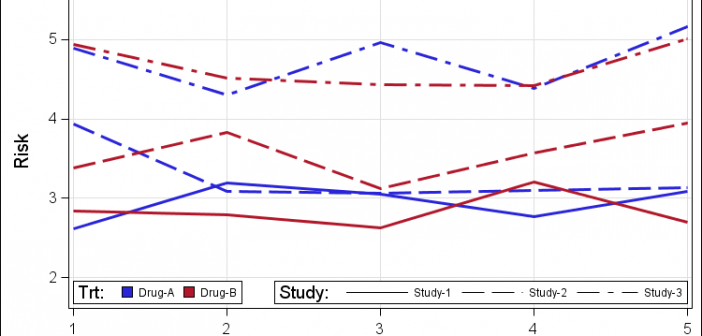
Often we have the need to see the data by two different classifiers at the same time, as requested by a recent query on the SAS Communities page. In this example I have simulated a response over time for patients by study and treatment. We want to create series plots
Tag: Clinical Graphs
A week ago, SAS "wusses" got together in Long Beach, California for another successful WUSS conference. Personally, I really enjoy all SAS user conferences as it gives me an opportunity to see the creative ways in which SAS users are exploiting our software. One such case was the paper "Power
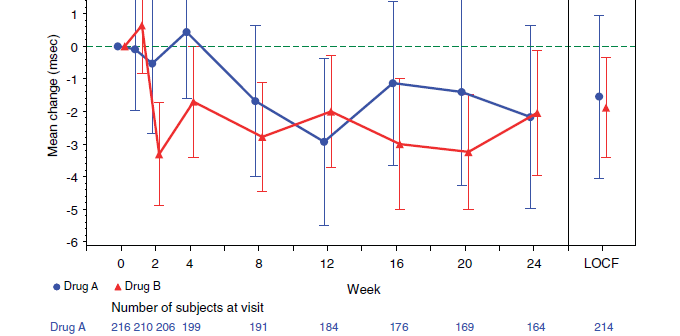
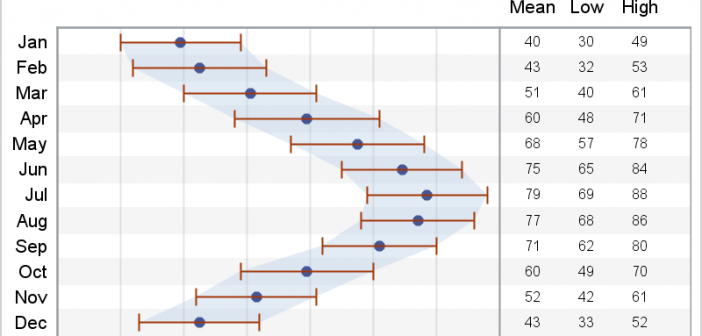
A key element of graphs used for analysis of safety data for clinical research is the inclusion of statistical data (or tables) about the study that are aligned with the x axis of the graph. A common example of this comes from the paper "Graphical Approaches to the Analysis of
CTSPedia.org is a website of Knowledge Base for Clinical and Translational Research. On this site you can find sample graphs for statistical analysis of safety data for Clinical Research. Graphs included in this resource have been submitted by contributors, and include a graph for Liver Function for different tests by treatment.
On Friday before the conference, I presented a 1 day "developer led" seminar on SG Procedures and GTL, along with a discussion of new features for SAS 9.3. The experience was very gratifying as all users were now using SAS 9.2, and some were using SAS 9.3. We had a lively
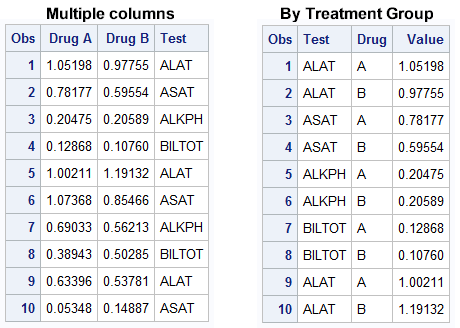
The graph showing the distribution of the maximum liver function test values by treatment for all participants in a study is commonly used for the analysis of safety data in clinical trials. The data is often structured in multiple columns (one per treatment) as below on the left, or grouped by
A new book from SAS Press, "Statistical Graphics Procedures by Example" co-authored by Dan Heath and I has now been published (phew!). For both Dan and I, this was our first foray into writing a book, so it was highly educational to say the least. The key idea behind the presentation
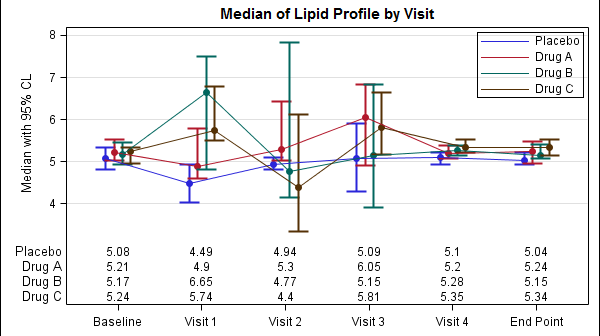
In a previous article we discussed how to add axis aligned statistics table to a Lipid graph using GTL. Other graphs such as the Survival Plot also utilize the same technique to display the "at risk" statistics aligned by time or visits along the X axis. Often, we also need to display
The display of statistics, aligned with graphical plot of the data, is a common requirement for graphs, especially in the Clinical Research domain. In the previous post on Discrete Offset, I used an example of the Lipid Profile graph. Now, let us use the same example and add the display of statistics in