Clinical Graphs

Data Visualization
Sanjay Matange 4
Report from WUSS 2012

A week ago, SAS "wusses" got together in Long Beach, California for another successful WUSS conference.  Personally, I really enjoy all SAS user conferences as it gives me an opportunity to see the creative ways in which SAS users are exploiting our software. One such case was the paper "Power

Data Visualization
Sanjay Matange 2
LFT Panels

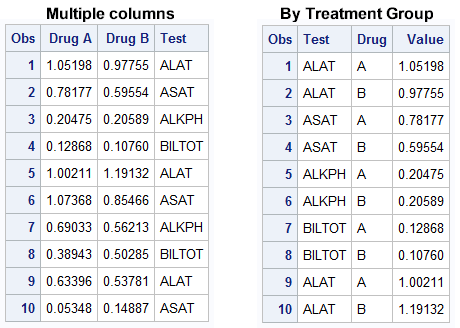
CTSPedia.org is a website of Knowledge Base for Clinical and Translational Research.  On this site you can find sample graphs for statistical analysis of safety data for Clinical Research.  Graphs included in this resource have been submitted by contributors, and include a graph for Liver Function for different tests by treatment.