Author

Sanjay Matange
RSS
Director, R&D

Sanjay Matange is R&D Director in the Data Visualization Division responsible for the development and support of the ODS Graphics system, including the Graph Template Language (GTL), Statistical Graphics (SG) procedures, ODS Graphics Designer and related software. Sanjay has co-authored a book on SG Procedures with SAS/PRESS.

Data Visualization
Sanjay Matange 4
Stock chart

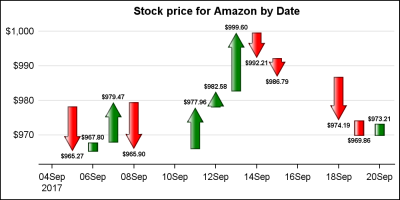
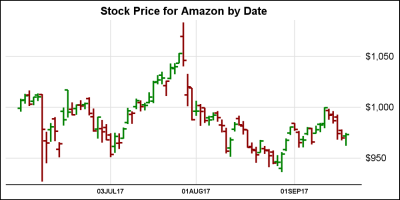
In the previous article on Getting Started with Vertical HighLow Plot, I described how we can use the HighLow plot to display the stock price by date.  The HighLow plot is specifically designed for such use cases as shown below. The data is downloaded from the Nasdaq web site, and

Data Visualization
Sanjay Matange 6
Lollipop Charts

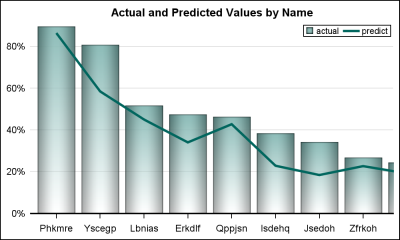
Recently, while reading up on Wilkinson and Cleveland Dot plots, I saw this excellent article by Xan Gregg on the topic.  I also saw some interesting examples of Lollipop Charts, kind of a dot plot with statistics along with a drop line, maybe more suitable for sparse data.  I thought

1 2 3 4 5 6 30