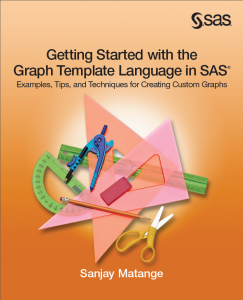
If you have been reading the articles in this blog, you already know that the Graph Template Language (GTL) forms the underlying foundation for all graphs produced automatically from SAS analytical procedures and custom graphs created with the SG Procedures and the ODS Graphics Designer.
SG procedures and Designer provide easy ways to create graphs using GTL behind the scenes. But each of them only support 30-40% of the GTL feature set. What do you do if you need some feature beyond what these provide? What if you like one of the automatic graphs from a SAS analytical procedure, say the Survival Plot from LIFETEST procedure, and you want to customize it to suit your needs? Well in these cases, you need to use GTL.
Now, you may have heard that GTL has a bit of a learning curve. But, if you are ready to learn more about the GTL, then your timing is just right. My new book on "Getting Started with the Graph Template Language in SAS" will be released early next month. This book will get you started building GTL graphs quickly, bypassing the learning curve.
Also, I will be presenting a related SAS Talk on GTL tomorrow (Oct 17, 2013) at 1pm. Sign up for the SAS Talk to learn all about getting started using the Graph Template language.


6 Comments
Fantastic, I can't wait to read this book!
Thanks for your commen< Kriss. You know, this is a "Getting Started" book, and you likely already know this material.
That's fine Sanjay, I'm sure there are still a few tips that I can get from the book.
Thanks for the post, Sanjay. I ordered your GTL book at MWSUG. Looking forward to reading it. While "you can't judge a book by its cover", yours is terrific.
Perry
The credit for the nice cover goes to Aimee Rodriguez and Luis Franco.
Pingback: Getting Started with GTL – 1 – Scatter Plots - Graphically Speaking