Registration is now open for the SAS Analytics Experience 2017, being held September 18-20, in Washington, DC. (The Analytics Experience moves to Amsterdam, October 16-18 -- details on that event to follow.) For anyone interested in FVA analysis, Chip Wells and I will be delivering a half-day pre-conference training session
Author
My colleague Gerhard Svolba (Solutions Architect at SAS Austria) has authored his third book, Applying Data Science: Business Case Studies Using SAS®." While the book covers a broad range of data science topics, forecasters will be particularly interested in two lengthy case studies on "Explaining Forecast Errors and Deviations" and
The Foresight Practitioner Conference returns to Raleigh, NC (November 15-16), with a theme of "Recoupling Forecasting with Inventory Control and Supply Planning." This event is produced jointly by Foresight and the North Carolina State University Institute for Advanced Analytics, and deals with an important topic. Too often we consider forecasting
So you think you are smarter than the average forecaster, and can identify a trend in time series data? You now have a chance to put your trend detection skills (aka trendar) to the test, and help the cause of forecasting research in the process. Nikos Kourentzes, Associate Professor at
Preview of the Spring 2017 Issue of Foresight Since our first issue in 2005, Foresight has strived to serve up articles that unite the scholarship of our field’s academic researchers with the perspectives of experienced organizational practitioners, all the time emphasizing lessons learned—and sometimes those lessons are learned the hard
While The BFD normally favors a lighter approach, with a focus on forecasting process (the politics and personalities therein), forecasting news, and forecasting gossip, we sometimes have to get serious. In this guest blogger post from Koen Knapen, Principal Consultant at SAS Belgium, Koen takes us into the netherworlds of
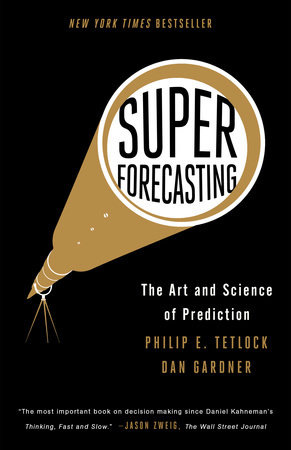
Good Judgment® Open Ever wondered how good you are at forecasting? As a business forecaster, you can do the usual comparison against a naive model (and hopefully you are beating it!). You might also compare your forecast accuracy to published industry benchmarks -- although I would strongly recommend against this.
To make it easy to identify non-value adding areas, you can build a simple application using SAS® Visual Analytics software. Such an application lets you point and click your way through the organization’s forecasting hierarchy, and at each point view performance of the Naïve, Manual, Statistical, and Automated forecasts (or
To properly evaluate (and improve) forecasting performance, we recommend our customers use a methodology called Forecast Value Added (FVA) analysis. FVA lets you identify forecasting process waste (activities that are failing to improve the forecast, or are even making it worse). The objective is to help the organization generate forecasts
Preview of the Winter 2017 issue of Foresight Foresight begins the new year with our 44th issue since the journal began publishing in 2005, and in this Winter 2017 collection we’re showcasing a broad range of incisive and entertaining pieces. We’re looking at new research on the effectiveness of collaboration