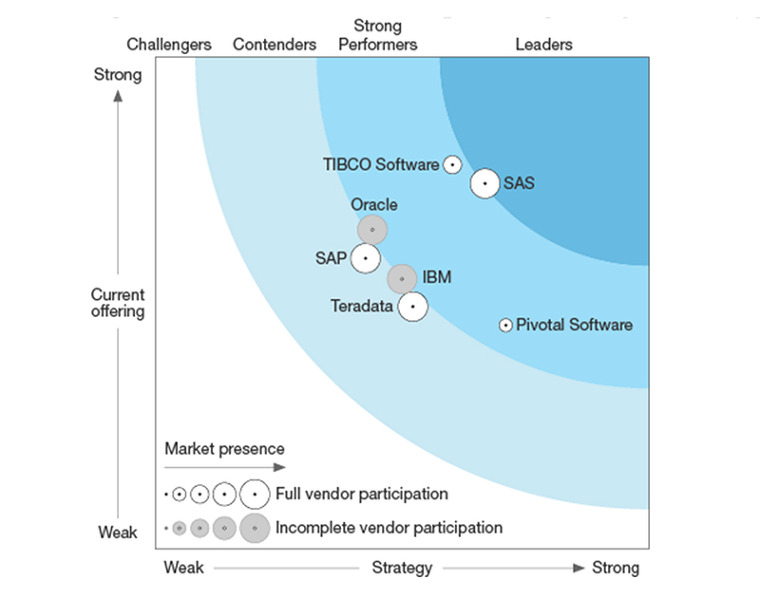
‘포레스터 웨이브: 2016년 4분기 엔터프라이즈 인사이트 플랫폼 스위트’ 보고서에서 단독 리더로 선정 전략∙최신 오퍼링∙시장 입지 평가 항목에서 높은 점수 획득 ··· 기업의 의사 결정 시점에 인사이트 적용을 지원하는 차별화된 리더로서 확고한 입지 개방형∙클라우드 기반 분석 아키텍처 ‘SAS 바이야(SAS Viya)’, 보다 현대적이고 단순화된 아키텍처로 높이 평가 2017년 1월 23일, 서울 세계적인

The U.S. Marshals Service is the federal agency known for bringing wanted fugitives to justice. Often, the Marshals Service gets attention for these arrests, but once the publicity has died down they face a basic challenge --- where to put the individuals in their custody. The agency uses data to
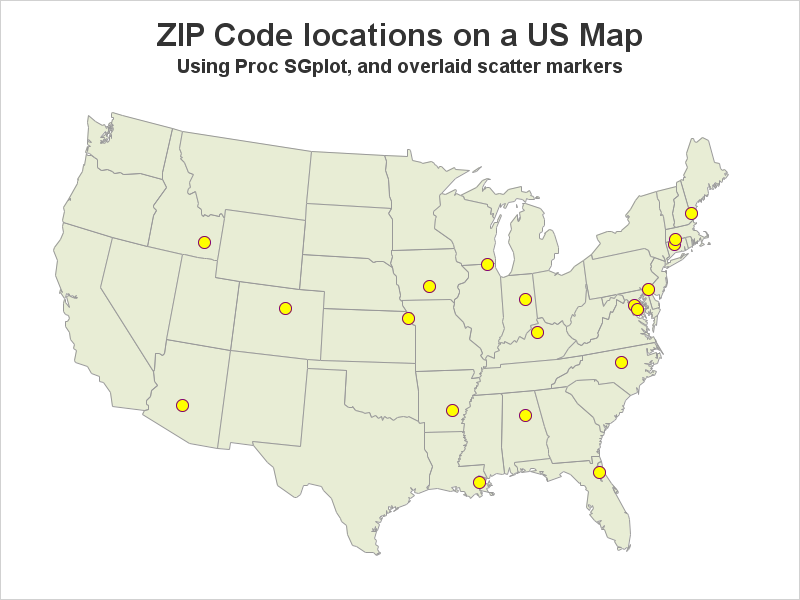
Users frequently ask how to plot their data as markers on a map. There are several ways to do this using SAS software. If you're a Visual Analytics user, you can do it using a point-and-click interface. But if you're a coder, you might need a little help... In this