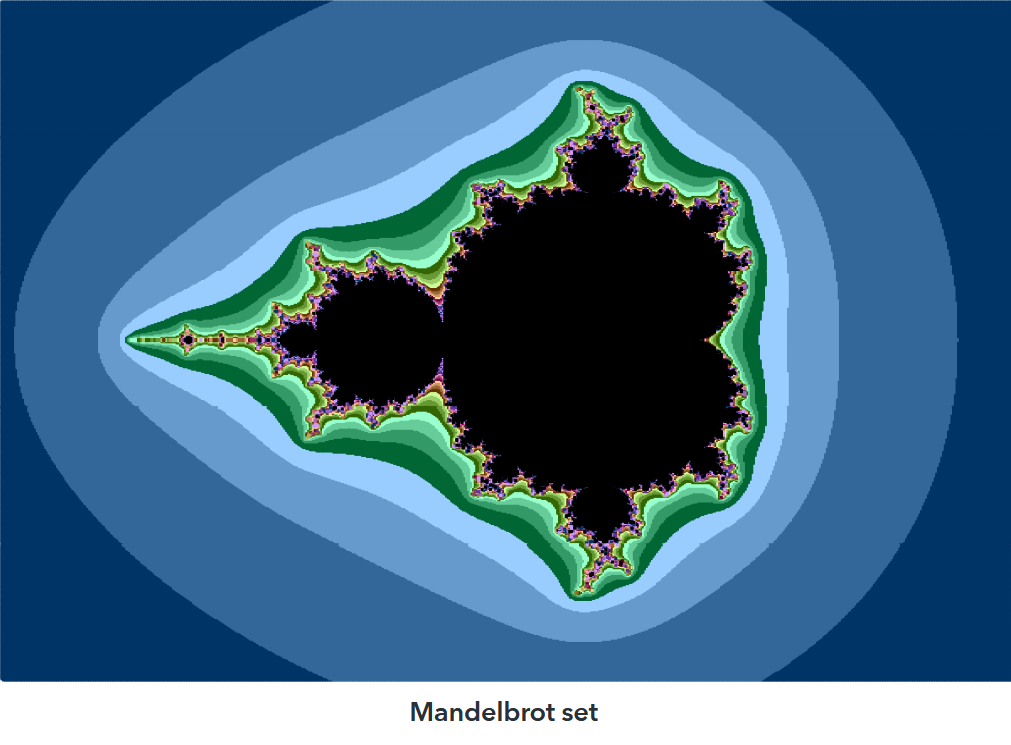
Tech
Cindy Wang's curiosity about the Mandelbrot set led her to draw one using SAS Visual Analytics.
Tech
Cindy Wang's curiosity about the Mandelbrot set led her to draw one using SAS Visual Analytics.
You've probably heard by now the new SAS Viya runs on containers orchestrated by Kubernetes. There is a lot to know and learn for both experienced users and k8s noobies alike. I would recommend searching the SAS Communities Library for a wealth of information on deployment, administration, usability, and more.
This blog demonstrates how to create a report that provides only the column headings for data that is missing. The blog also explains how to create, select, and exclude output objects as well as how to generate reports with the SASĀ® Output Delivery System (ODS). These concepts are relevant to the task of generating a report with the column headings for a data set that contains no (0) observations.