Feature du jour
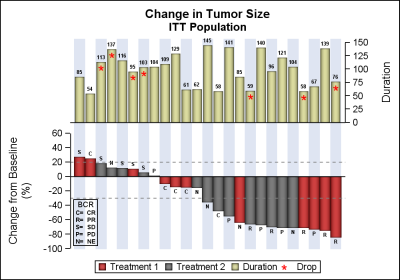
Clinical graphs: Waterfall plot ++

Waterfall plots have gained in popularity as a means to visualize the change in tumor size for subjects in a study. The graph displays the reduction in tumor size in ascending order with the subjects with the most reduction on the right. Each subject is represented by a bar classified by