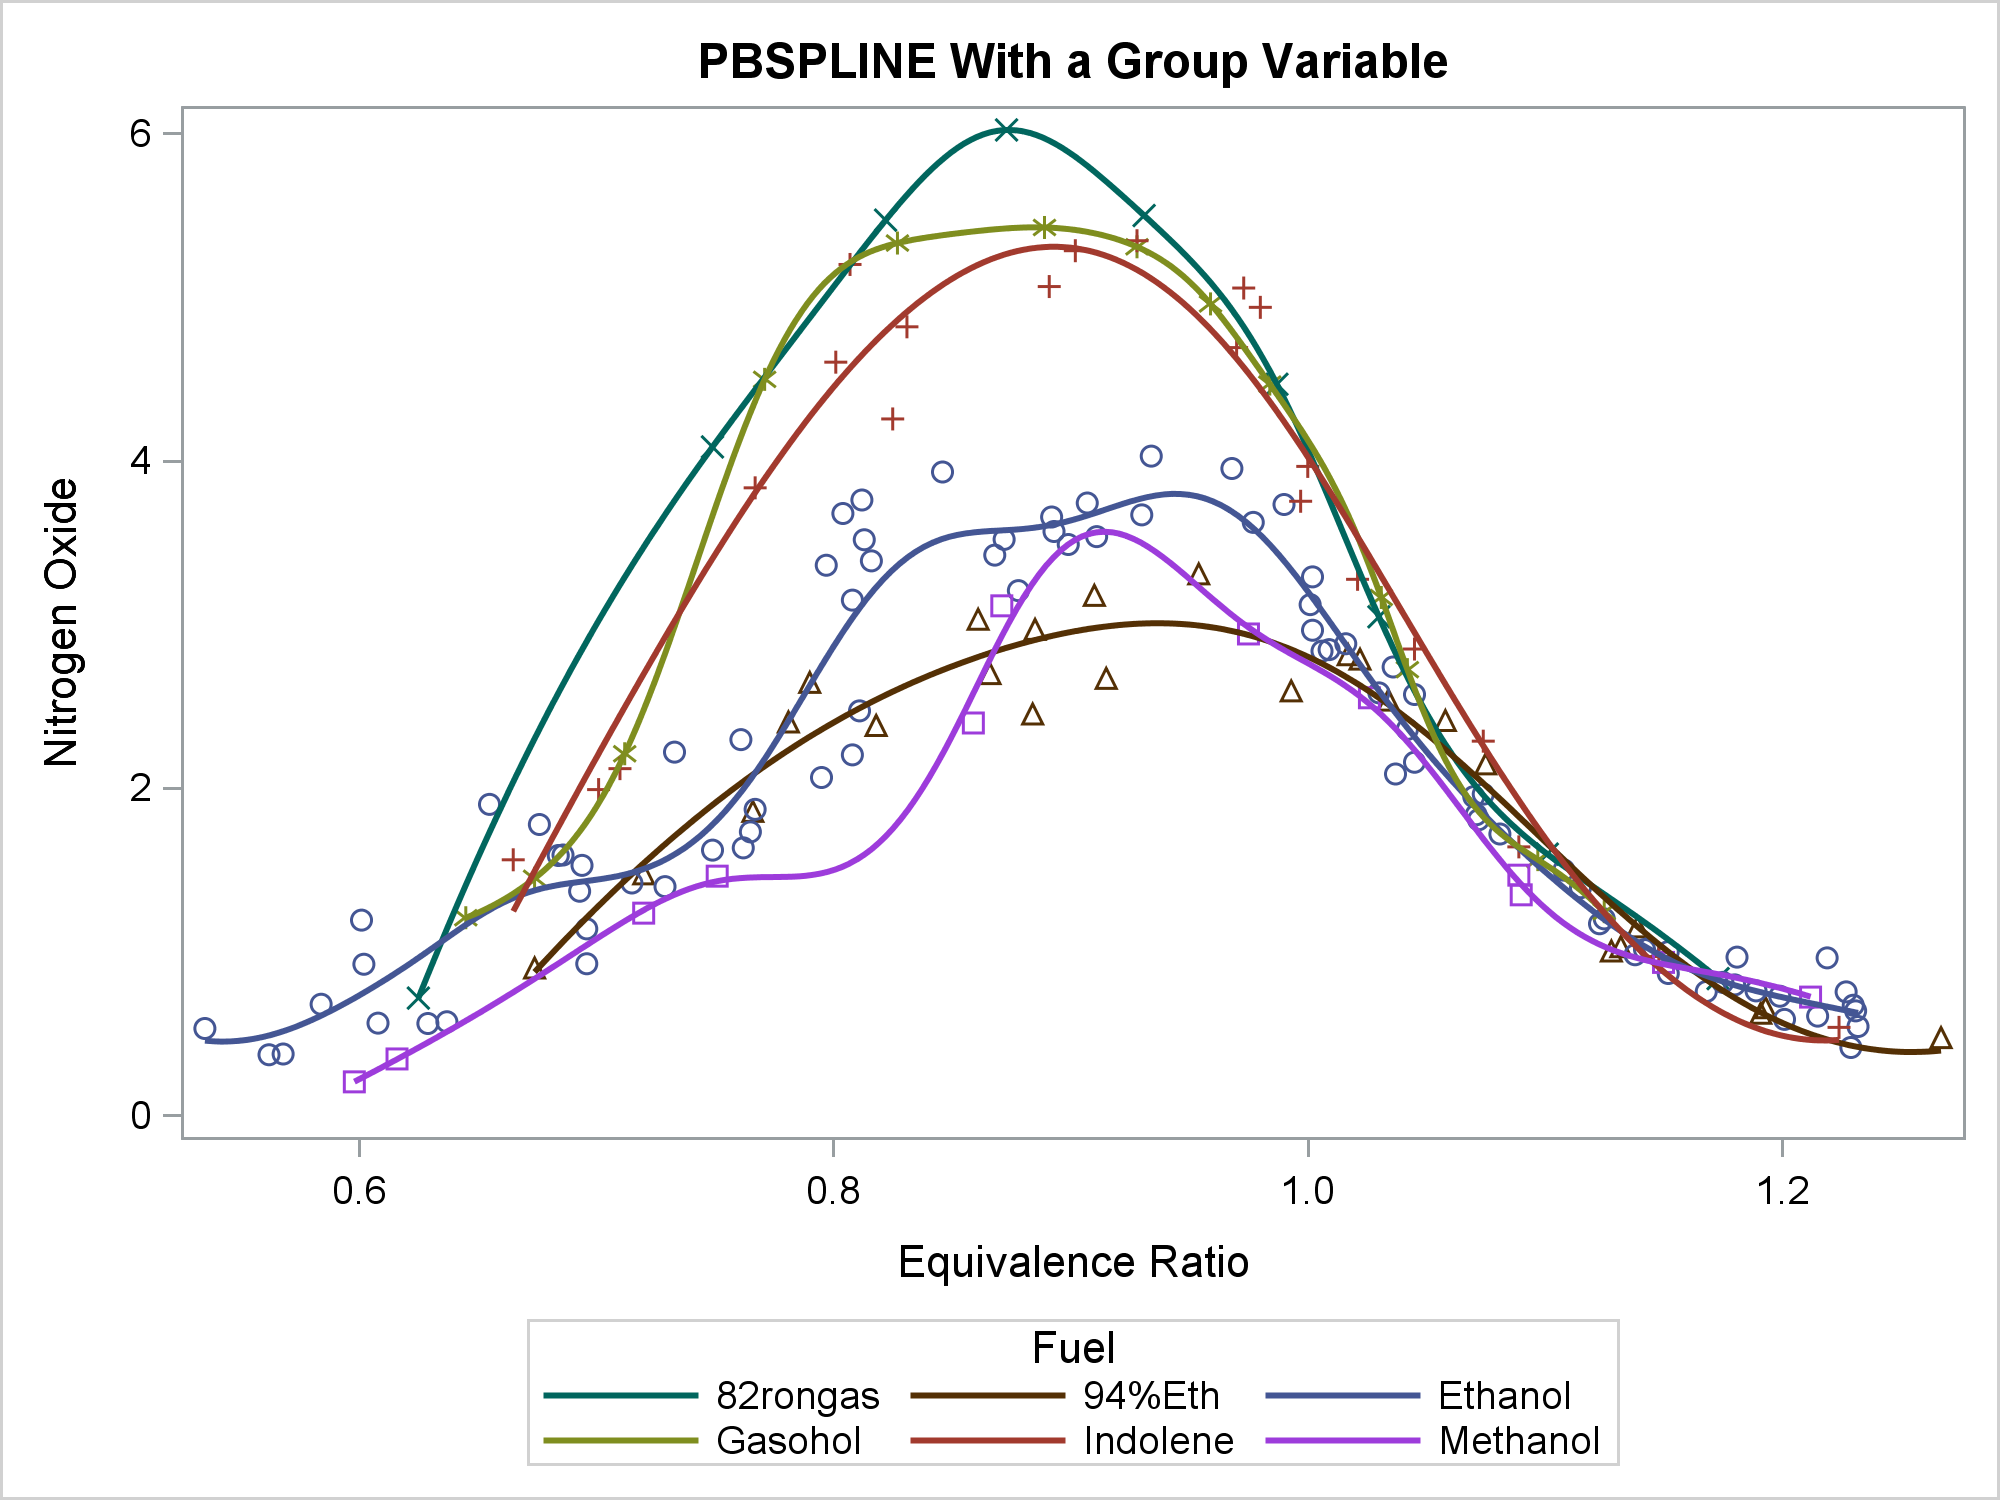
You can use penalized B-splines display a smooth curve through a set of data. The PBSPLINE statement fits spline models, displays the fit function(s), and optionally displays the data values.
The REG statement fits linear regression models, displays the fit functions, and optionally displays the data values. You can fit a line or a polynomial curve. You can fit a single function or when you have a group variable, fit multiple functions.
This post provides examples of DRAW statement syntax and links to the documentation.