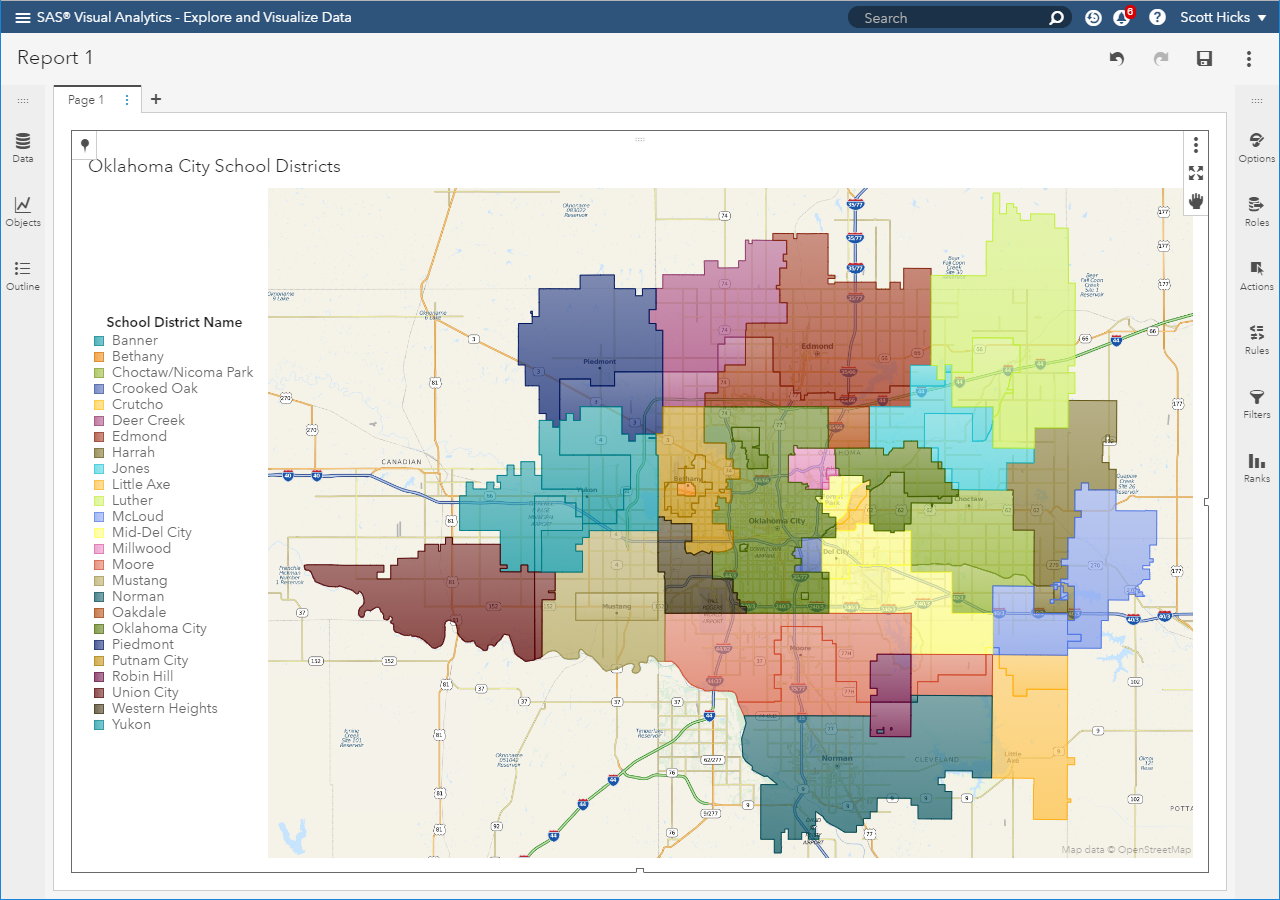
Geocoding is no longer limited to just Base SAS. You can also geocode from within Visual Analytics, thanks to the integration with the Esri geocoding api. This feature is part of the Esri Premium agreement, and became available in VA 8.3.

Geocoding is no longer limited to just Base SAS. You can also geocode from within Visual Analytics, thanks to the integration with the Esri geocoding api. This feature is part of the Esri Premium agreement, and became available in VA 8.3.

If you spend any time working with maps and spatial data, having a fundamental understanding of coordinate systems and map projections becomes necessary. It’s the foundation of how spatial data and maps work. These areas invariably evoke trepidation and some angst, even in the most seasoned map professional. And rightfully

The catch phrase “everything happens somewhere” is increasingly common these days. That “somewhere” translates into a location on the Earth; a latitude and longitude. When one of these “somewhere’s” is combined with many other “somewhere’s”, you quickly have a robust spatial data set that becomes actionable with the right analytic