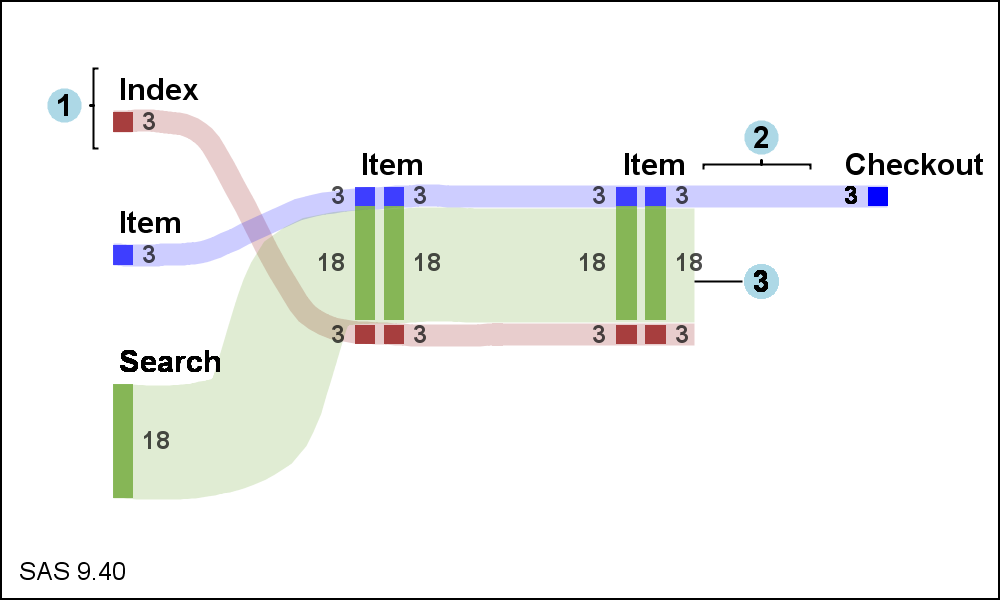
Author

Sanjay Matange
RSS
Director, R&D

Sanjay Matange is R&D Director in the Data Visualization Division responsible for the development and support of the ODS Graphics system, including the Graph Template Language (GTL), Statistical Graphics (SG) procedures, ODS Graphics Designer and related software. Sanjay has co-authored a book on SG Procedures with SAS/PRESS.

Data Visualization
Sanjay Matange 0
Sankey Diagrams

Sankey Diagrams have found increasing favor for visualization of data.  This visualization tool has been around for a long time, traditionally used to visualize the flow of energy, or materials.   . Now to be sure, GTL does have a statement design for a Sankey Diagram which was implemented only in Flex for use

1 41 42 43 44 45 100