Author

Sanjay Matange
RSS
Director, R&D

Sanjay Matange is R&D Director in the Data Visualization Division responsible for the development and support of the ODS Graphics system, including the Graph Template Language (GTL), Statistical Graphics (SG) procedures, ODS Graphics Designer and related software. Sanjay has co-authored a book on SG Procedures with SAS/PRESS.

Data Visualization
Sanjay Matange 0
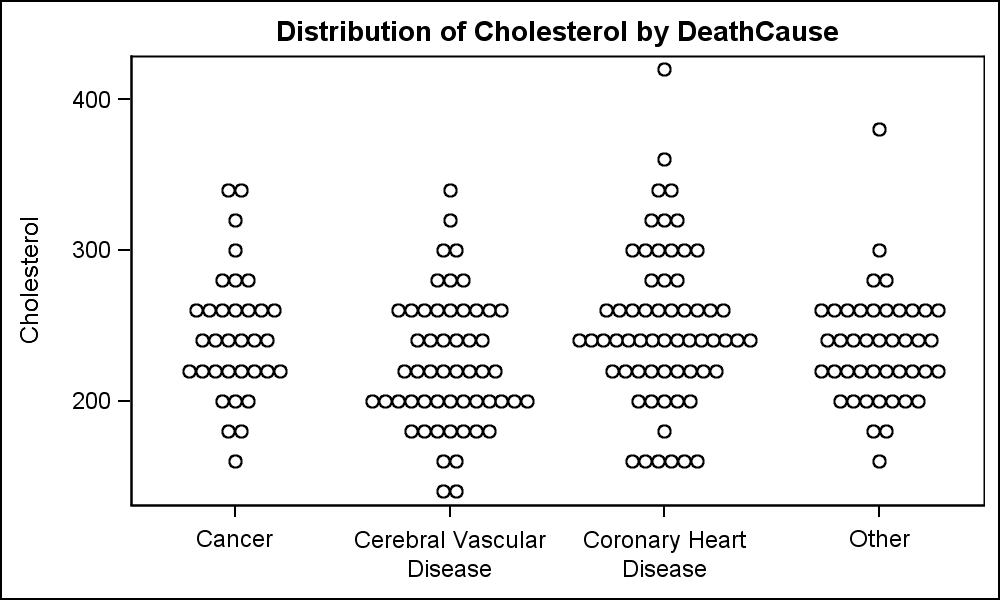
Scalable Turnip Graph

A Turnip Graph displays the distribution of an analysis variable.  The graph displays markers with the same (or close) y coordinate by displaying the markers spread out over the x-axis range in a symmetric pattern.  Recently, a question was posted on the SAS Communities page regarding such a graph. Here is an example of

1 26 27 28 29 30 100