Author

Rick Wicklin
RSS
Distinguished Researcher in Computational Statistics

Rick Wicklin, PhD, is a distinguished researcher in computational statistics at SAS and is a principal developer of SAS/IML software. His areas of expertise include computational statistics, simulation, statistical graphics, and modern methods in statistical data analysis. Rick is author of the books Statistical Programming with SAS/IML Software and Simulating Data with SAS.

Rick Wicklin 0
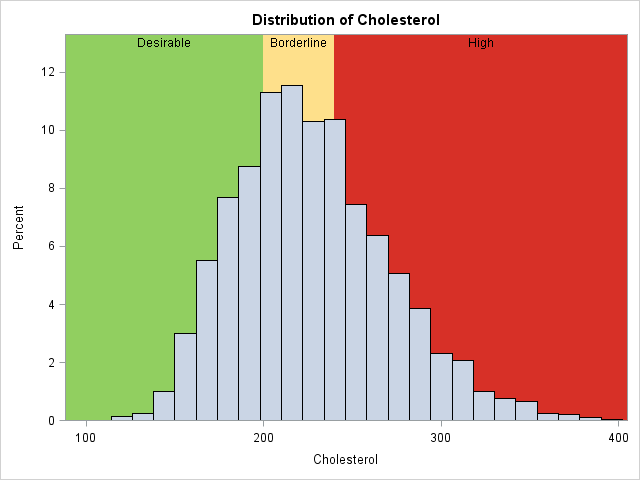
Overlay categories on a histogram

Recently Sanjay Matange blogged about how to color the bars of a histogram according to a gradient color ramp. Using the fact that bar charts and histograms look similar, he showed how to use PROC SGPLOT in SAS to plot a bar chart in which each bar is colored according

Rick Wicklin 0
Arrange matrices and graphs in a gridded layout

Last week my colleague Chris Hemedinger published a blog post that described how to use the ODS LAYOUT GRIDDED statement to arrange tables and graphs in a panel. The statement was introduced in SAS 9.4m1 (December 2013). Gridded layout is supported for HTML, POWERPOINT, and the PRINTER family of destinations

1 311 312 313 314 315 540