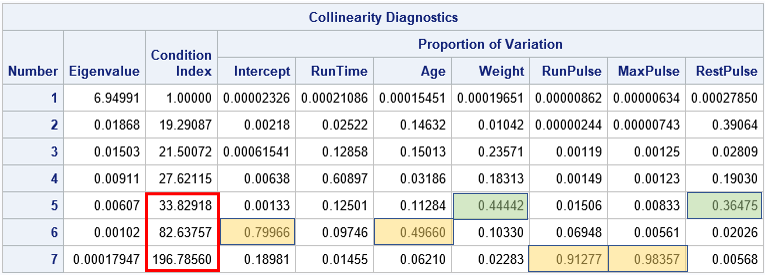
A 2-D "bin plot" counts the number of observations in each cell in a regular 2-D grid. The 2-D bin plot is essentially a 2-D version of a histogram: it provides an estimate for the density of a 2-D distribution. As I discuss in the article, "The essential guide to
Author
Create a conditional quantile bin plot in SAS
Math-ing around the Christmas tree: Can the SVD de-noise an image?
Rockin' around the Christmas tree At the Christmas party hop. – Brenda Lee Last Christmas, I saw a fun blog post that used optimization methods to de-noise an image of a Christmas tree. Although there are specialized algorithms that remove random noise from an image, I am not going to
Swap elements in binary matrices
Binary matrices are used for many purposes. I have previously written about how to use binary matrices to visualize missing values in a data matrix. They are also used to indicate the co-occurrence of two events. In ecology, binary matrices are used to indicate which species of an animal are