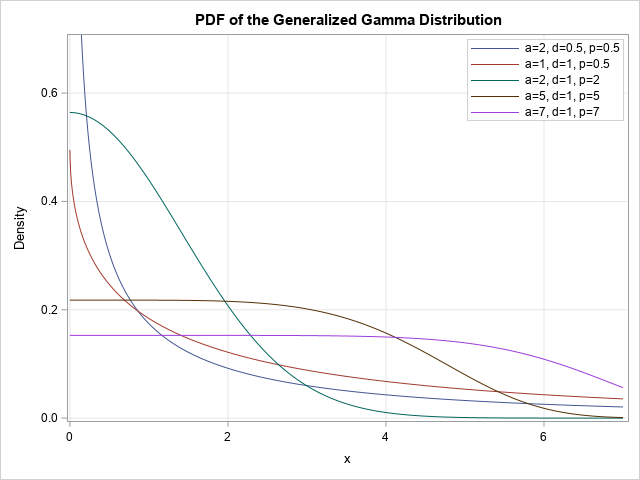
One of the first things I learned in SAS was how to use PROC PRINT to display parts of a data set. I usually do not need to see all the data, so my favorite way to use PROC PRINT is to use the OBS= data set option to display
Look at the following matrices. Do you notice anything that these matrices have in common? If you noticed that the rows of each matrix are arithmetic progressions, good for you. For each row, there is a constant difference (also called the "increment") between adjacent elements. For these examples: In the
In a previous article, I showed how to generate random points uniformly inside a d-dimensional sphere. In that article, I stated the following fact: If Y is drawn from the uncorrelated multivariate normal distribution, then S = Y / ||Y|| has the uniform distribution on the unit sphere. I was