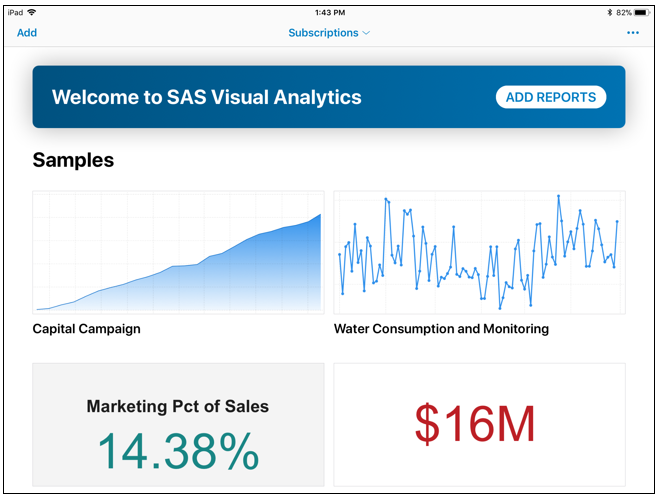
If you use SAS Visual Analytics and don’t have the SAS Visual Analytics app, you're missing out on a ton of convenience and interaction you could be having while on-the-go. This post outlines the app highlights.
Report data shared by educational institutions, government agencies, healthcare organizations, and human resource departments can contain sensitive or confidential data. Data in such reports are suppressed selectively to protect the identities of individuals or to prevent the report’s audience from easily inferring individual values. The Data Suppression feature in SAS
Jazz up your Geo Map or Network Analysis graph by applying icon-based display rule markers instead of color markers on the map. With SAS Visual Analytics, you may have already used display rules by populating intervals or adding color-mapped values for report objects. Now, you can jazz up your Geo