My elderly mother enjoys playing Scrabble®. The only problem is that my father and most of my siblings won't play with her because she beats them all the time! Consequently, my mother is always excited when I visit because I'll play a few Scrabble games with her.
During a recent visit, I managed to squeak out a couple of rare victories. (The key is to play when she's tired, like right before naptime!) The following panel shows a concise summary of our games (click to enlarge):
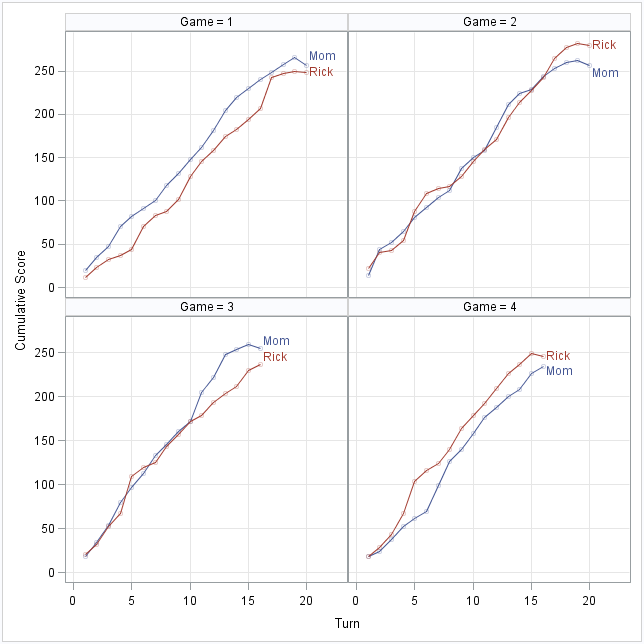
The graphic display has the following features:
- You can see the score after each turn.
- You can see the number of turns in each game (16–20).
- The average slope of the line indicates the average number of points per word (about 14 points).
- The gap between the curves shows the difference in scores at each turn.
In particular, you can read off some important plays for each game:
- In Game 1, I was losing the entire game. I almost caught up with a 36-point play at Turn 16, but it was too little, too late.
- In Game 2, the lead changed hands five times, as seen by the crossing of the curves.
- In Game 3, I was holding my own until Mom crushed my hope with a 33-point word on Turn 11.
- In Game 4, I cruised to victory after playing a 37-point word in Turn 4.
I call this a "play-by-play chart." A few years ago, I saw this display used very effectively to show the minute-by-minute evolution of the score of a basketball game, but I can't remember where I saw it.
This display is best used to show the progression of scores for games that feature a lot of scoring, and especially games in which the points per turn can vary. For example, the chart is effective in basketball for seeing the effect of three-point plays and foul shots on the score. This would also be a good display for bowling, golf, and "target shooting" games such as darts and archery. I wouldn't use it for baseball or soccer.
The chart is easy to construct by using the SGPANEL procedure. I added semi-transparent observations in the background, but you can omit the SCATTER statement if you want to see only the lines.
proc sgpanel data=Scrabble noautolegend; panelby Game; scatter x=Turn y=Cumul / group=Player transparency=0.75; series x=Turn y=Cumul / group=Player curvelabel; rowaxis integer grid; colaxis grid; run; |
If you'd like to try an alternate visualization, you can download the data.
In addition to this play-by-play chart, you might be interested in the distribution of each player's word scores over multiple games. You can use the SGPLOT procedure for each player, or you can combine histograms into a single paneled display by using PROC SGPANEL as follows:
proc sgpanel data=Scrabble noautolegend; panelby Player; histogram Score; density Score / type=kernel; run; |
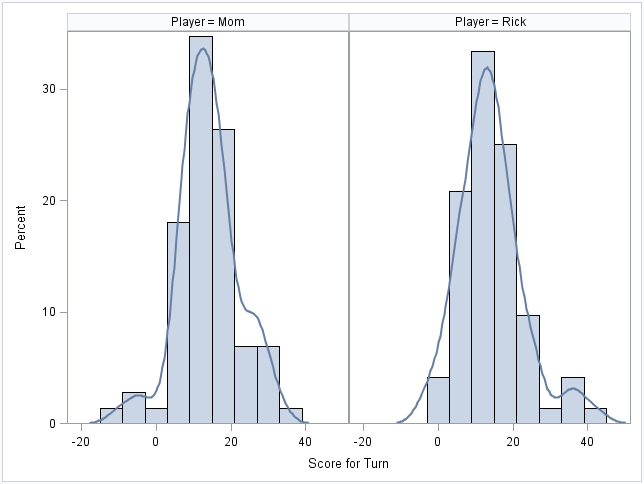
The distributions of scores reveal several differences in playing styles and strategies:
- For both players, the typical play scores 12–15 points.
- I tend to use all my tiles by the end of the game. My mother has tiles left over, which results in a penalty as seen by her negative scores at the end of games.
- Both distributions show a "triple word score" peak in the density. Hers is taller than mine is, which indicates that she plays more of the triple word scores. However, my peak is farther to the right, which indicates that my triple word scores tend to be larger.
My mother plays a defensive game. If a triple word score space is playable, she grabs it, even if it results in a paltry score for her. (This aggravates my father!)
I only play Scrabble recreationally, but the SGSPANEL procedure enables me to visualize my scores and analyze my playing style. For me, Scrabble is fun to play... and fun to analyze.
