Halloween appears to be my favorite holiday, because I seem to have more graphs related to it than any of the others. And since Halloween is just a few days away, I thought you might like an easy way to see all those graphs.
Here's are links to my previous Halloween-related blog posts, containing lots of clever graphs and maps:
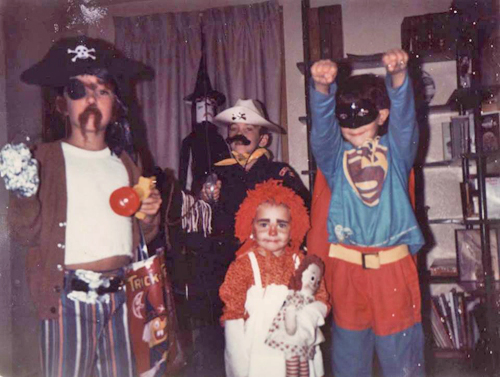
- Superman -vs- Batman ... Halloween smackdown!
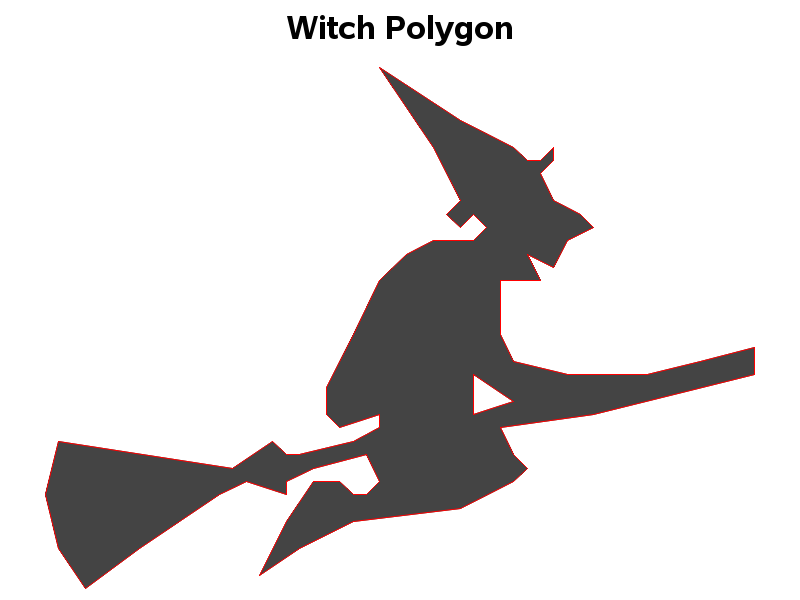
- Create Halloween images and learn SAS basics
- Need help choosing a Halloween costume?
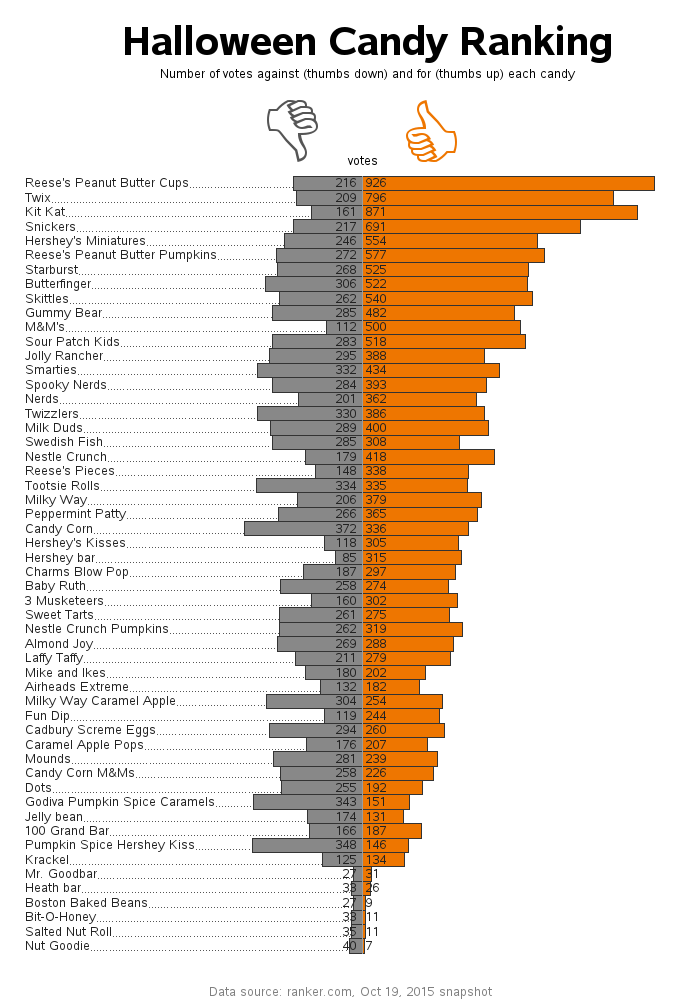
- Get the inside scoop for your Halloween candy selection
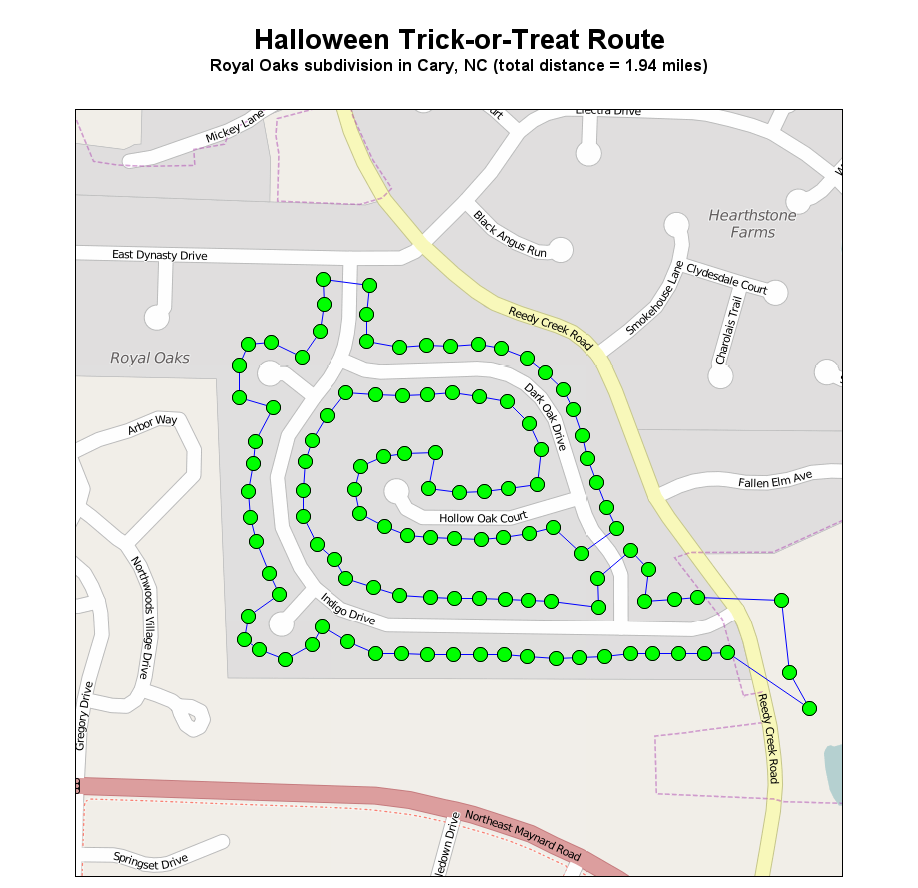
- How a data scientist plans his trick-or-treat route
- Are you at risk? Which blood types do vampires prefer?
Or, if you're more of a visual person, here's a pictorial interface (click each image to go to the blog posts). The same person is in two of these photos - can you guess who? :-)

Have you seen any interesting Halloween-related data lurking out there? Perhaps you have an idea for some future graphs and analyses I can do!?! (feel free to leave a comment with your suggestions)


