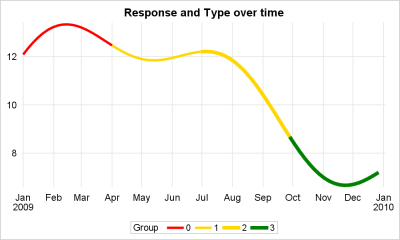
This article is motivated by a recent question on the SAS Communities board. This user wants to create a series or spline plot where the attributes of the line (color, thickness) can be changed based on another variable. In this case it may be a binary variable with "0" and
Tag: Series
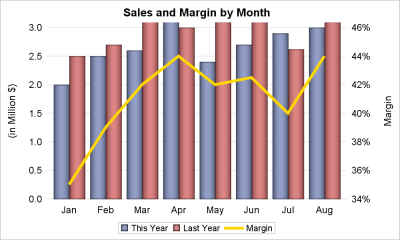
A dual response axis chart is useful when the data type for the multiple measures are not compatible. For example, when overlaying measures like "This Year" sales with "Last Year" sales, the format and magnitudes of the two measures (or values for two groups) may be compatible, and it is
This is the 4th installment of the Getting Started series. The audience is the user who is new to the SG Procedures. Experienced users may also find some useful nuggets of information here. Series plots are frequently used to visualize a numeric response on the y-axis by another numeric variable on
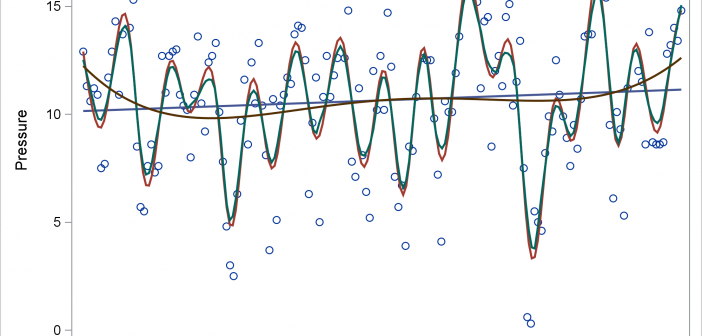
Today's post illustrates the REG, PBSPLINE, LOESS, SERIES, and SPLINE statements in PROC SGPLOT. The GROUP= and BREAK options in the SERIES statement are also discussed.
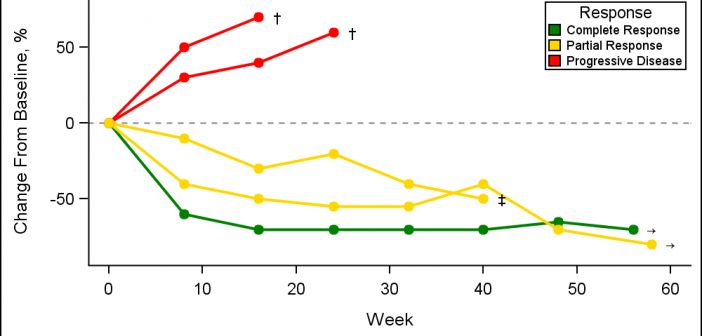
A Spider Plot is another way of presenting the Change from Baseline for tumors for each subject in a study by week. The plot can be classified by response and stage. Another way of displaying Tumor Response data was discussed earlier in the article on Swimmer Plot. This article is prompted
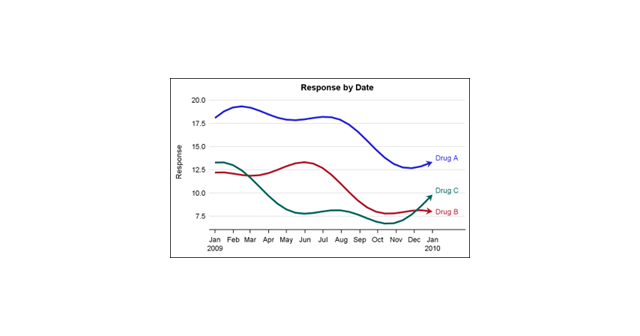
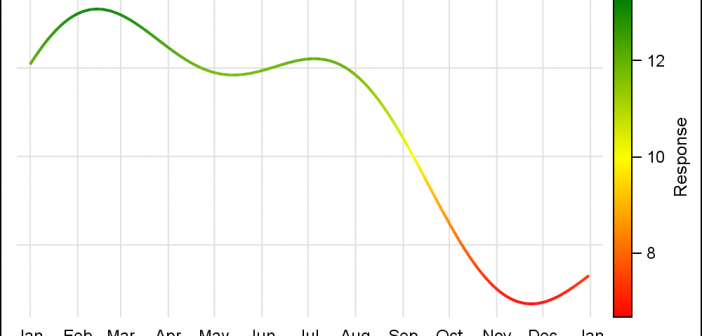
Returning from my recent visit to India, I was reading an article that included a graph with a series plot where the color of the series itself changed based on the Y response. Now, for sure, the SAS 9.40M3 SERIES plot in the SGPLOT procedure supports color response, but that applies
An interesting question came up recently, where a colleague wanted to create a bar line chart with Revenue on the Y axis and Profit on the Y2 axis. The Revenues were all positive, but the Profit had positive and negative values. Some data I generated is shown on the right. Creating this
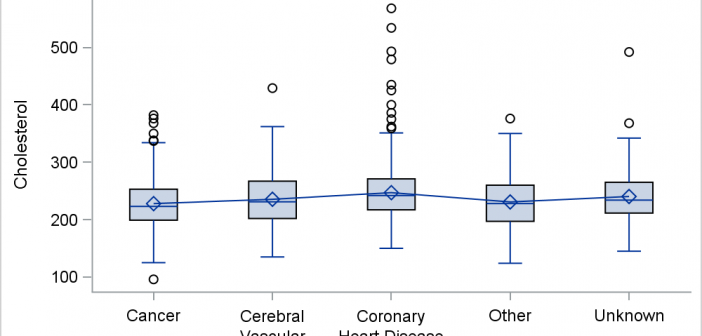
This blog post is motivated by a post by a user on the communities page about creating a box plot with colored boxes by category and multiple connect lines. Normally, a box plot can be drawn by category, with a single connect line for one of the statistical values of
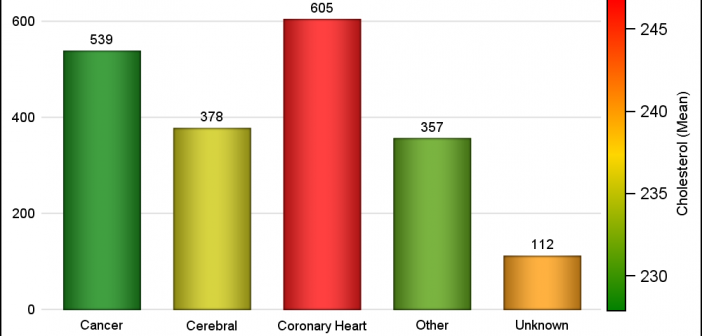
Often there is a need to display more than one response simultaneously for a bar chart, series plot or a vector plot. SAS 9.40M3 adds the options you need to get such results using two new options COLORRESPONSE and THICKRESPONSE where applicable. The Bar Chart on the right shows the frequency
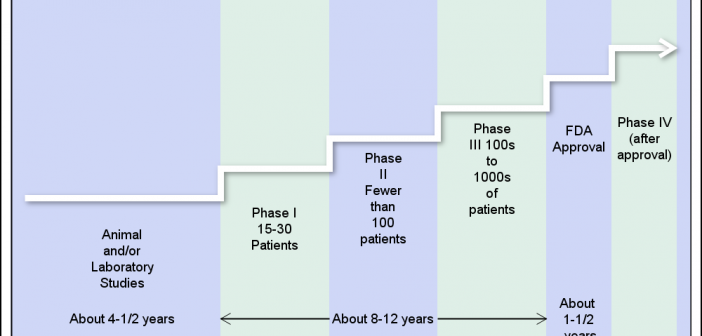
The SGPLOT procedure provides great tools to create all kinds of graphs for all domains from business to clinical. However, every so often, we need to create visuals that are not exactly graphs, but more like flow or network diagrams, or something entirely unique. Some users may have tools to