Search Results: swimmer (16)

Data Visualization
Sanjay Matange 1
Layers vs annotation

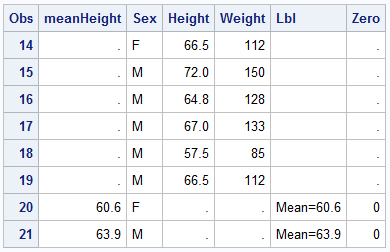
Last week a user asked about BY variable group processing for SGAnnotate with SGPLOT procedure.  The user provided a simple use case for the question (always a good idea) using the sashelp.class data set.  The graph included a display of reference lines for the mean value of height using annotation.  The

Data Visualization
Sanjay Matange 4
Report from PharmaSUG 2015

PharmaSUG 2015 in Orlando was held at the Renaissance had a record breaking attendance of over 650.  Weather was great, except for a huge downpour on the evening of the last day.  All the popular presenters were in attendance including Art Carpenter, Kirk Lafler, Arthur Li and many others. Presentations

Data Visualization
Sanjay Matange 3
CandleStick Chart

A HighLow plot is very popular in the financial industry, often used to track the periodic movement of a stock or some instrument or commodity.  The CandleStick Chart is one specific type of high low plot, purportedly originating in Japan for tracking of financial instruments in the rice trade. Creating a

Data Visualization
Sanjay Matange 8
Report from PharmaSUG 2014

Just getting back from PharmaSUG 2014 in San Diego.  The conference was great, both inside and outside.  The organizers ordered up some great weather for the Padres game and also for dinner on the flight deck of the Midway Carrier. Our focus here being on graphics, we were all extremely gratified by the presentations in