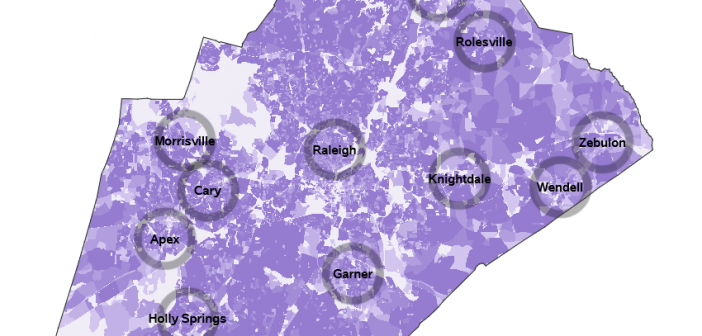
As the 2020 Census approaches, I'm getting my code ready to plot the data! And a question I often hear is "Can you use SAS software to plot data on a Census block map?" Rather than tell you 'yes', let me show you 'yes' 🙂 Preparing the map First I

As the 2020 Census approaches, I'm getting my code ready to plot the data! And a question I often hear is "Can you use SAS software to plot data on a Census block map?" Rather than tell you 'yes', let me show you 'yes' 🙂 Preparing the map First I
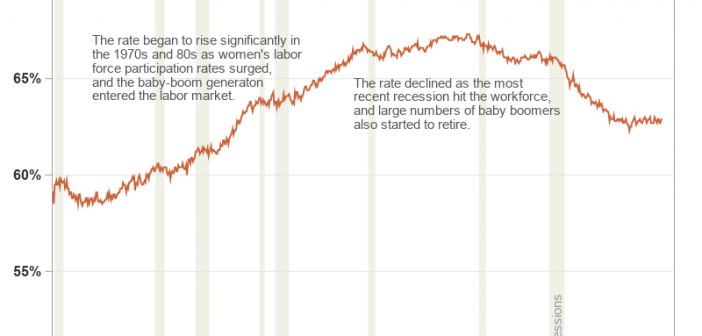
Plotting just your data often helps you gain insight into how it has changed over time. But what if you want to know why it changed? Although correlation does not always imply causation, it is often useful to graph multiple things together, that might logically be related. For example, recessions
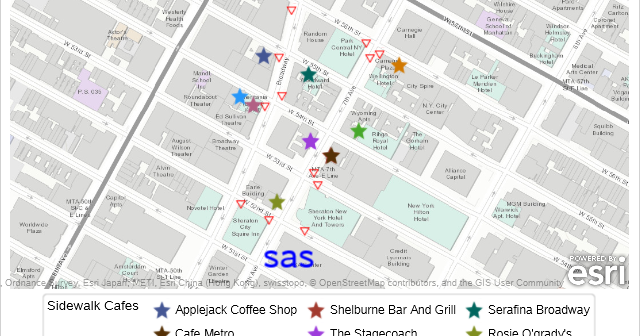
As mentioned in other PROC SGMAP blogs, several SAS/GRAPH procedures have been moved to 9.4M6 Base SAS to be used with PROC SGMAP. You can use these to create PROC SGMAP output even when using the free SAS University edition. In this blog you will use the: IMPORT procedure for
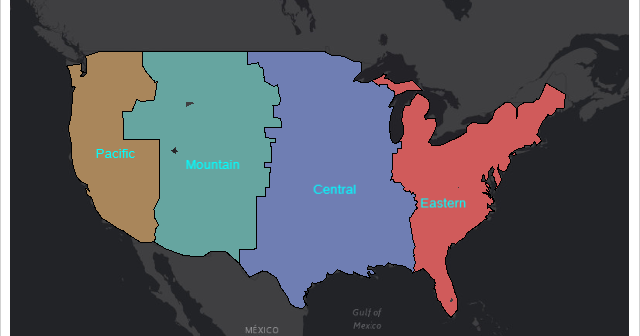
Starting with SAS 9.4M6, procedures that used to be provided with a SAS/GRAPH installation are now available with Base SAS. Using these procedures along with PROC SGMAP can help you create some very nice maps. This blog builds on previous posts and highlights the: MAPSSAS Data Sets GREMOVE procedure %CENTROID
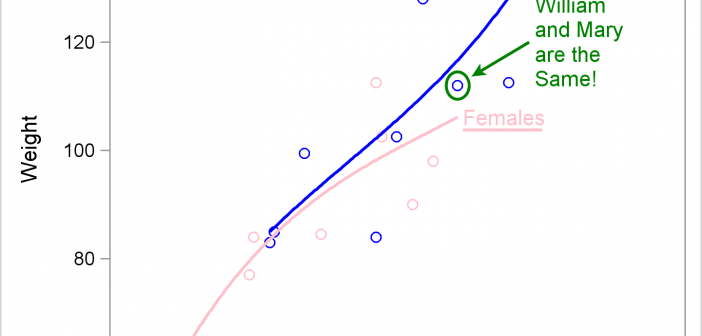
This post provides examples of DRAW statement syntax and links to the documentation.
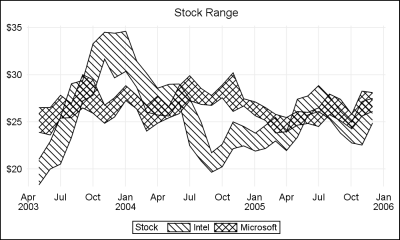
When a plot is classified by one or more variables, the different classes values are displayed in the graph either by position or by using different plot attributes such as color, marker shape or line pattern. For plots that display the visual by a filled area (bar, bin, band, bubble,

I hope everyone has noticed some new shortcuts in Graphically Speaking. As you scroll down and look to the right, there are shortcuts for Sanjay's getting started and clinical graphs posts and one for my advanced blogs. When Sanjay asked me to make an icon for my advanced blogs, at
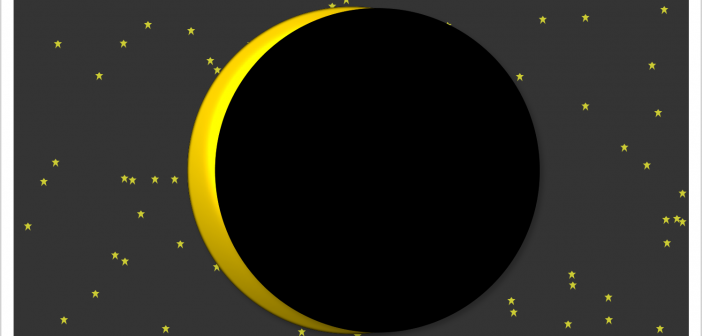
This example shows how to create two coordinated range attribute maps and use them in creating an animated gif of the eclipse.

Motivated by Ted Conway's post on creating a sequence of graphs showing the Solar Eclipse, I thought it would be fun to extend his code and create a gif animation. I used a frame count to 81, and used the printerpath feature to create the animation using SGPLOT with BY
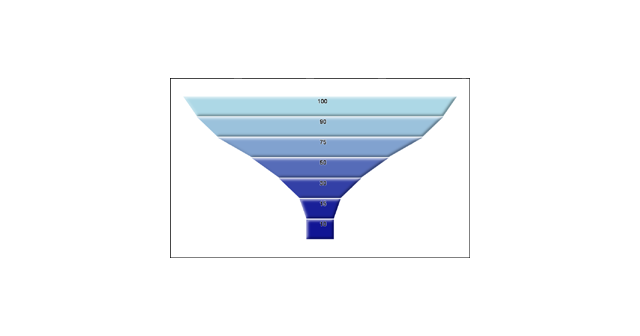
Funnel graphs are useful to track the number of visitors passing through various pages of a website or the number of patients in a study. The graph shows visually the retention of users or subjects in a study across levels of a marketing cycle or the study. One common representation