Often it is desirable to use special Unicode characters for the tick value names on the axes. However, SG procedures and GTL do not support Unicode strings in SAS data sets.
With SAS 9.3, the SGPLOT procedure supports annotation which does support Unicode strings. You can create an annotation data set that specifies the text strings you want, and then position these in place of the tick values from the data. See Dan's article on this topic: Graphical Swiss Army Knife.
SAS 9.3 GTL supports many DRAW statements for adding custom annotations in the graph. You can think of these as "inline annotation" statements. These are designed to add custom annotations into your graph that cannot be added using plot statements. In fact, the SG annotation function turns around and uses these statements to create the annotation. So, there is no reason why you cannot use these statements too.
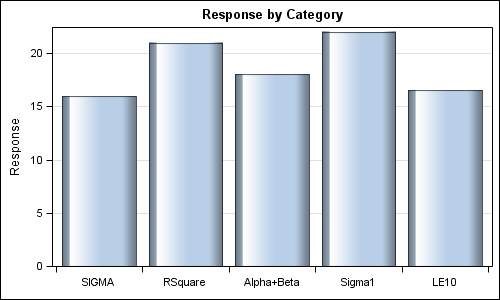
Here is an example of a graph showing response by categories. Note the category name strings.
SAS 9.3 GTL Program:
proc template; define statgraph Unicode1; begingraph; entrytitle 'Response by Category'; layout overlay / xaxisopts=(display=(ticks tickvalues) discreteopts=(ticktype=inbetween)) yaxisopts=(griddisplay=on); barchart x=cat y=Response / stat=mean dataskin=gloss; endlayout; endgraph; end; run; proc sgrender data=unicode template=Unicode1; run; |
The category value strings are "SIGMA", "RSquare" and so on, and we would like to replace them with Unicode strings. We will do this as follows:
- Turn of the drawing off the tick values.
- Add a bottom pad of 20 pixels to make room for the tick value strings.
- Use inline DRAW statements in the GTL program to draw the Unicode strings.
Here is the graph and the GTL program:
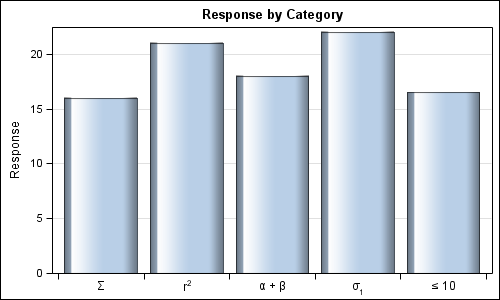
Now, the appropriate Unicode strings are drawn for each category, including superscripts and subscripts.
SAS 9.3 GTL Code:
ods escapechar = '~'; proc template; define statgraph Unicode2; begingraph / pad=(bottom=20px) ; entrytitle 'Response by Category'; layout overlay / xaxisopts=(display=(ticks) discreteopts=(ticktype=inbetween)) yaxisopts=(griddisplay=on); barchart x=cat y=Response / stat=mean dataskin=gloss; drawtext '~{unicode "03a3"x}' / x='SIGMA' y=-1 anchor=top xspace=datavalue yspace=wallpercent; drawtext 'r' {sup "2"} / x='RSquare' y=-1 anchor=top xspace=datavalue yspace=wallpercent; drawtext '~{unicode "03b1"x} + ~{unicode "03b2"x}' / x='Alpha+Beta' y=-1 anchor=top xspace=datavalue yspace=wallpercent; drawtext '~{unicode "03c3"x}' {sub "1"} / x='Sigma1' y=-1 anchor=top xspace=datavalue yspace=wallpercent; drawtext '~{unicode "2264"x} 10' / x='LE10' y=-1 anchor=top xspace=datavalue yspace=wallpercent; endlayout; endgraph; end; run; proc sgrender data=unicode template=Unicode2; run; |
Note, the drawing context for the text is DATAVALUE for X and WALLPERCENT for Y. With this, the x coordinates can be specified as the actual value of the tick on the x axis. The y coordinate is -1% (just below) the wall area, with text anchor point as TOP.
Inline DRAW statements are useful when creating a custom graph, where you can add the statements manually into the GTL code. Or, you could use macro logic to generate the statements.
In general, is easier to use SG Annotation when many annotations are to be created from the data set. SG Annotation is available with SAS 9.3 SG Procedures and will be available for SAS 9.4 GTL.
Full SAS 9.3 code: UnicodeTickValues


2 Comments
Hello, is it possible to get ticktype=inbetween to work using sgplot (pc sas 9.3)?
No, unfortunately that option is not available in SGPLOT.