Get the right information, with visual impact, to the people who need it
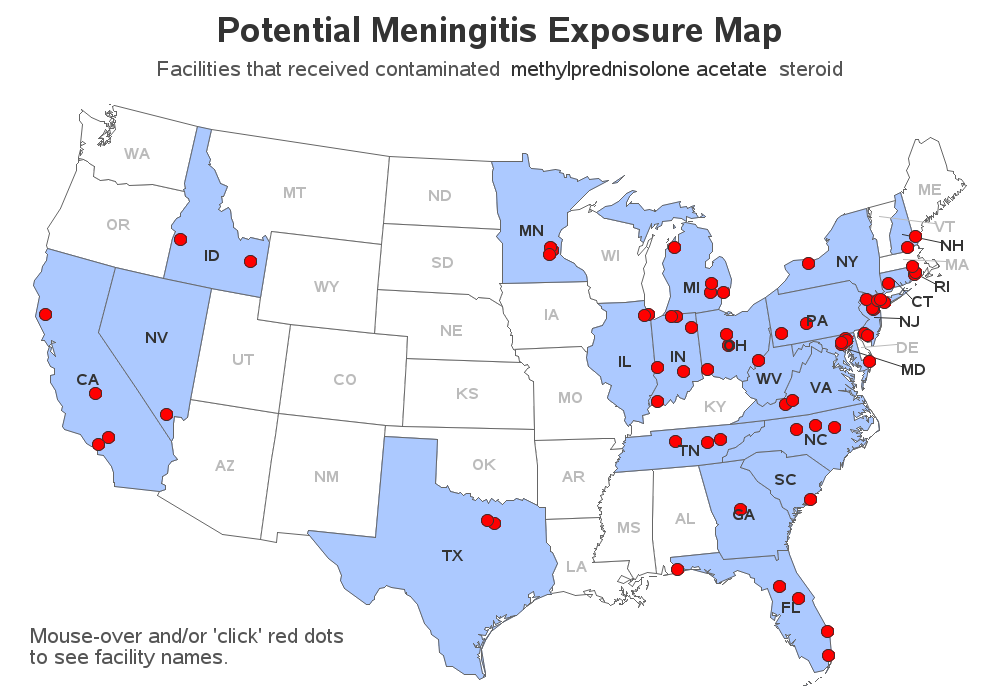
Building a better meningitis map

You've all heard about the recent meningitis outbreak, right? Being a data-guy and a map-guy, I went looking for maps related to the outbreak. I found the following map on the Centers for Disease Control (CDC) website. It shows the states that received the recalled drug used in epidurals (for back