Data Visualization

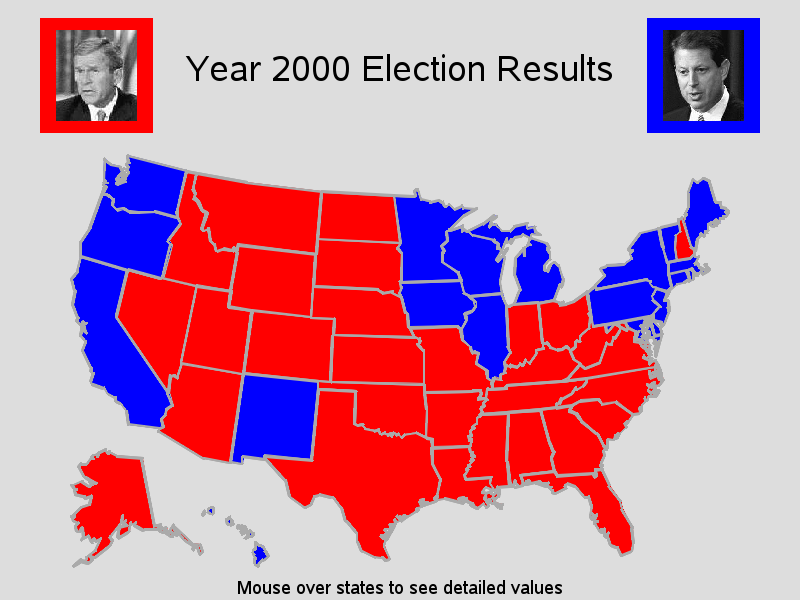
Get the right information, with visual impact, to the people who need it

Data Visualization
Sanjay Matange 0
Density Strip Plot

In the previous post on Violin Plots, we discussed the process to create custom density plots.  This work was done in collaboration with SAS user James Marcus.  This is the second installment on the same topic - Creating Density Strip Plots.  We will use the same data and process to compute

Data Visualization
Sanjay Matange 0
Violin Plots

Over the past month or more, I have been in a conversation with SAS user James Marcus, on creation of some new displays for visual communication of uncertainty.  These include display of densities using a "Violin" plot, "Density Strips" and more.   With his permission, I can share some of the

1 497 498 499 500 501 537