Get the right information, with visual impact, to the people who need it
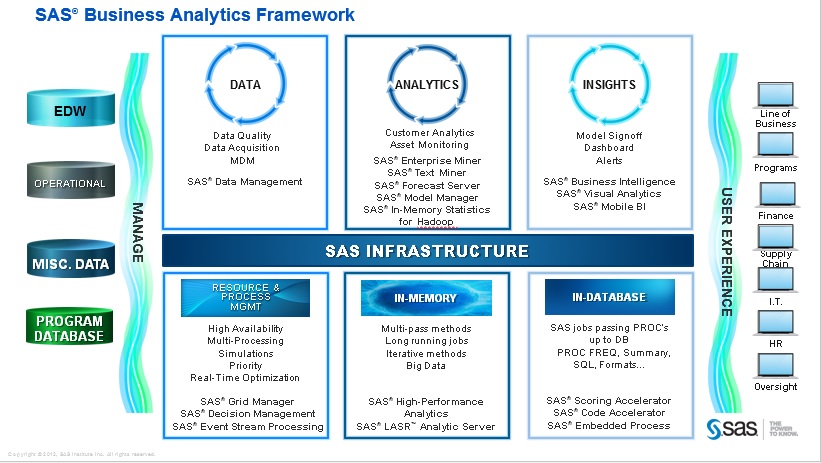
Does the architecture matter as much as the analytics?

I was recently part of team discussing enterprise architecture with a chief IT architect, and we were explaining how SAS can integrate into their existing infrastructure, add business value on top it and even fit into their future planned infrastructure. This conversation was one of the reasons I blogged about
