Get the right information, with visual impact, to the people who need it
Spotting a misleading chart

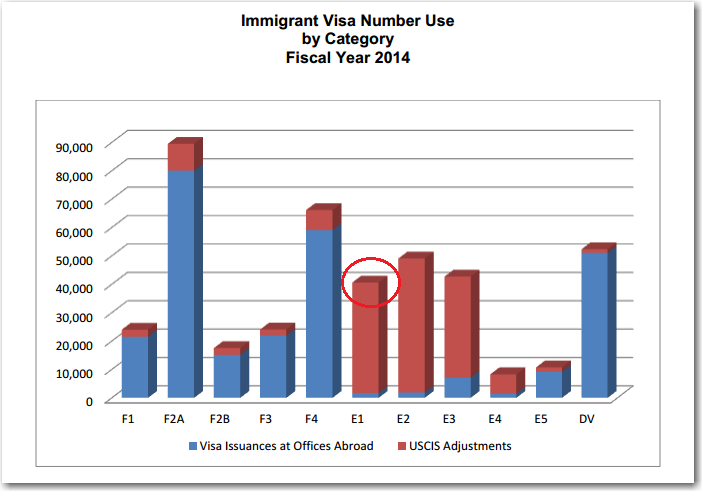
Everyone loves a good conspiracy theory - hopefully you'll enjoy mine about the number of US E1 visas! I was perusing some of the US government charts, and found one on US immigration visas that caught my attention. It was a 3D bar chart, and since I always mistrust 3D