Get the right information, with visual impact, to the people who need it
Attributes Priority for the Inquiring Mind

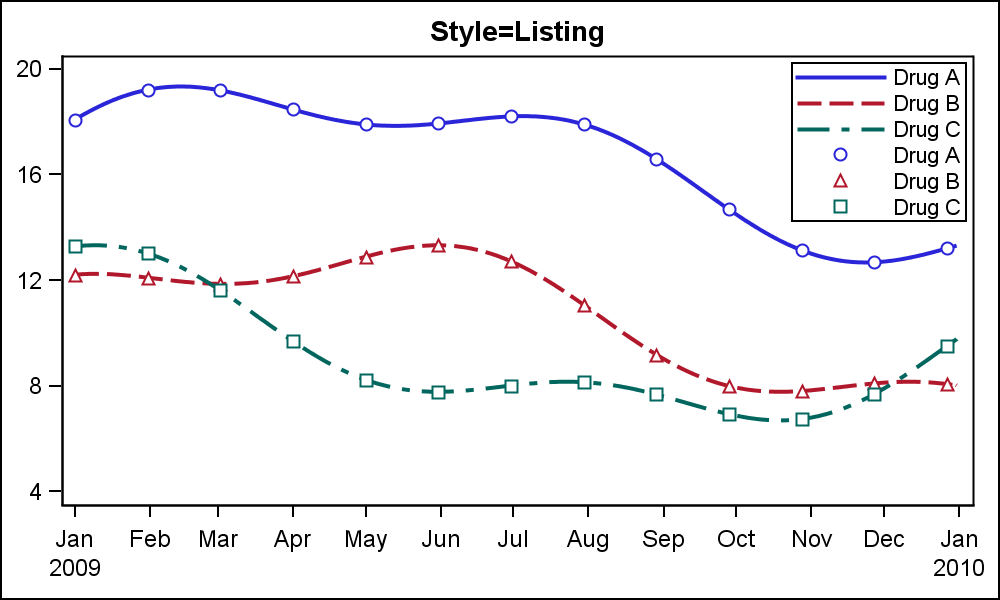
When ODS Graphics was first released with SAS 9.2 in 2008, a conscious effort was made to create graphs that were consistent and aesthetically pleasing out of the box. Features in the graph derive their visual attributes from the active Style. When Group classifications are in effect, the different classification