Get the right information, with visual impact, to the people who need it
Will independent voters decide the election?

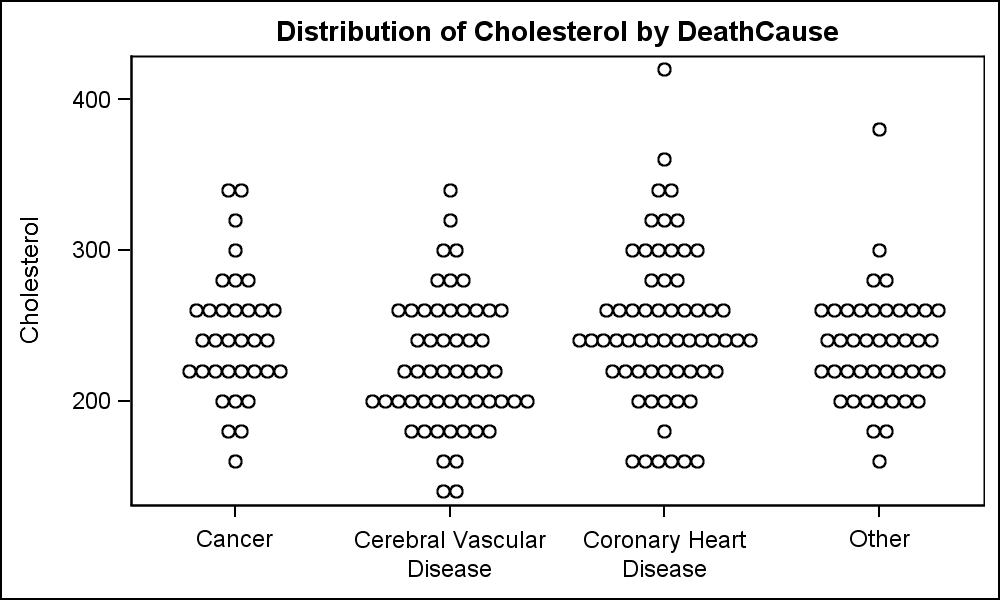
In recent years, more and more people have been registering as independent voters in the US, rather than Democrat or Republican - the independents now control well over 1/3 of the votes. Will they likely vote for the Democrat or Republican candidates in the upcoming election? Let's break down some numbers