Get the right information, with visual impact, to the people who need it

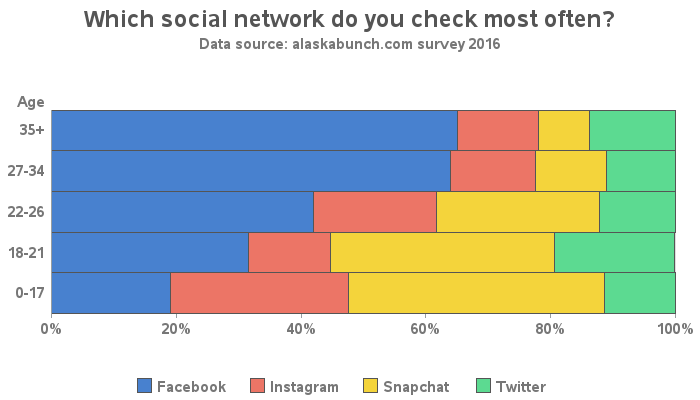
Likert Graph Revisited

A few weeks back I posted an article on ways to create a WindRose Graph using SGPLOT procedure. The process is relatively simple. Create (R, Theta) data with both numeric axes where the Theta is a value in the data range is 0-360, and R is the corresponding response value. Then