Get the right information, with visual impact, to the people who need it
If we didn't start the fire, then who did?

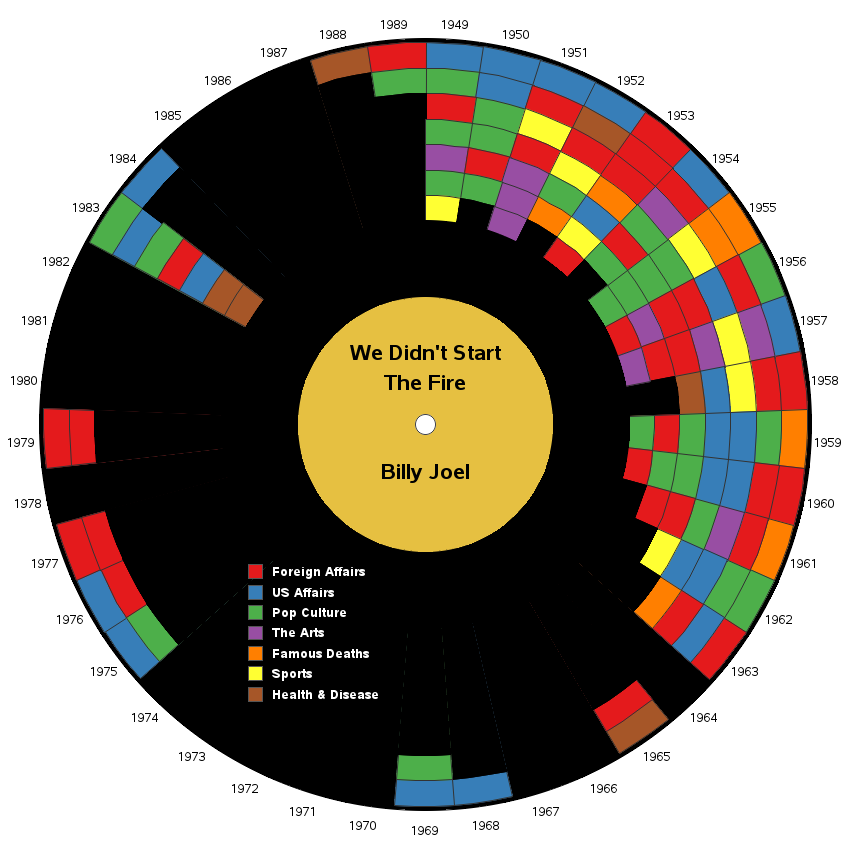
If you're into 1980s pop music, then I bet you love Billy Joel's song We Didn't Start the Fire. But do you know every word, and the significance of every reference? Let's use SAS software to create an interactive visualization that will help you fully understand this song! I first saw